Estimated Value: $789,000 - $959,000
3
Beds
2
Baths
1,800
Sq Ft
$488/Sq Ft
Est. Value
About This Home
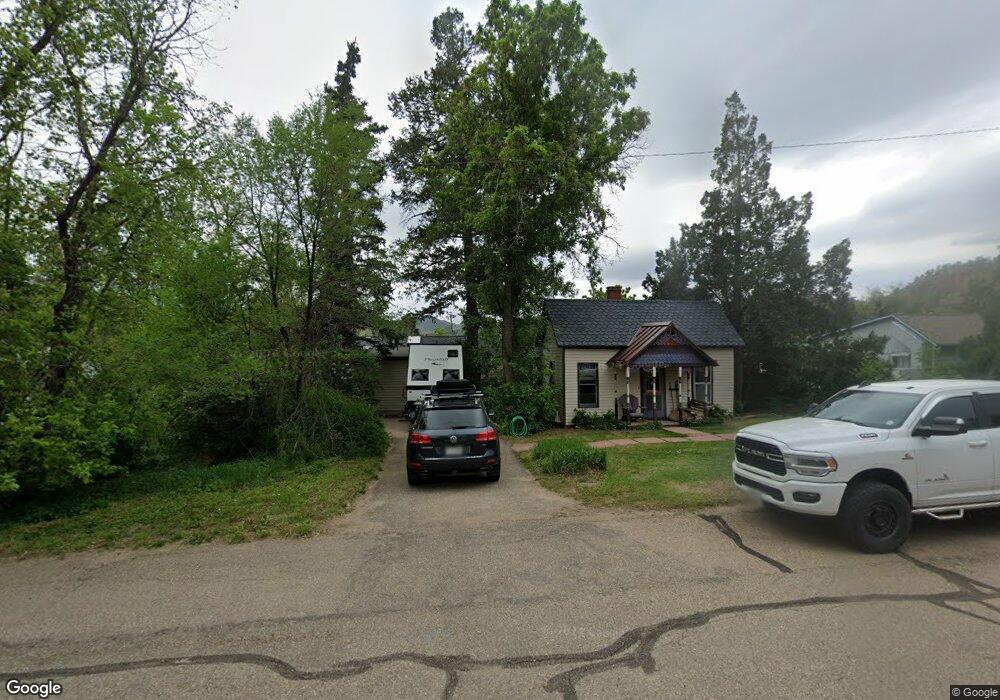
This home is located at 435 Reese St, Lyons, CO 80540 and is currently estimated at $878,983, approximately $488 per square foot. 435 Reese St is a home located in Boulder County with nearby schools including Lyons Elementary School and Lyons Middle/Senior High School.
Ownership History
Date
Name
Owned For
Owner Type
Purchase Details
Closed on
Nov 24, 2003
Sold by
Libin Karen
Bought by
Coulson Scott
Current Estimated Value
Home Financials for this Owner
Home Financials are based on the most recent Mortgage that was taken out on this home.
Original Mortgage
$252,000
Outstanding Balance
$116,259
Interest Rate
5.93%
Mortgage Type
Purchase Money Mortgage
Estimated Equity
$762,724
Purchase Details
Closed on
May 23, 1994
Sold by
Faulk Edward James and Faulk Margo P
Bought by
Libin Karen
Home Financials for this Owner
Home Financials are based on the most recent Mortgage that was taken out on this home.
Original Mortgage
$104,000
Interest Rate
6.5%
Purchase Details
Closed on
Dec 22, 1992
Bought by
Coulson Scott and Coulson Rebecca
Purchase Details
Closed on
Jun 30, 1989
Bought by
Coulson Scott and Coulson Rebecca
Purchase Details
Closed on
May 11, 1981
Bought by
Coulson Scott and Coulson Rebecca
Create a Home Valuation Report for This Property
The Home Valuation Report is an in-depth analysis detailing your home's value as well as a comparison with similar homes in the area
Home Values in the Area
Average Home Value in this Area
Purchase History
| Date | Buyer | Sale Price | Title Company |
|---|---|---|---|
| Coulson Scott | $315,000 | -- | |
| Libin Karen | $130,000 | -- | |
| Coulson Scott | $98,500 | -- | |
| Coulson Scott | -- | -- | |
| Coulson Scott | $60,500 | -- |
Source: Public Records
Mortgage History
| Date | Status | Borrower | Loan Amount |
|---|---|---|---|
| Open | Coulson Scott | $252,000 | |
| Previous Owner | Libin Karen | $104,000 | |
| Closed | Coulson Scott | $31,450 |
Source: Public Records
Tax History Compared to Growth
Tax History
| Year | Tax Paid | Tax Assessment Tax Assessment Total Assessment is a certain percentage of the fair market value that is determined by local assessors to be the total taxable value of land and additions on the property. | Land | Improvement |
|---|---|---|---|---|
| 2025 | $6,377 | $46,981 | $5,256 | $41,725 |
| 2024 | $6,377 | $46,981 | $5,256 | $41,725 |
| 2023 | $6,291 | $53,620 | $4,884 | $52,421 |
| 2022 | $4,910 | $39,824 | $4,469 | $35,355 |
| 2021 | $4,851 | $40,969 | $4,597 | $36,372 |
| 2020 | $4,105 | $34,349 | $11,726 | $22,623 |
| 2019 | $4,023 | $34,349 | $11,726 | $22,623 |
| 2018 | $3,990 | $34,754 | $11,808 | $22,946 |
| 2017 | $3,925 | $38,423 | $13,054 | $25,369 |
| 2016 | $3,327 | $28,680 | $11,622 | $17,058 |
| 2015 | $3,163 | $25,337 | $3,821 | $21,516 |
| 2014 | $2,626 | $25,337 | $3,821 | $21,516 |
Source: Public Records
Map
Nearby Homes
- 418 Seward St
- 819 5th Ave
- 418 High St
- 1117 5th Ave
- 1117 N 5th Ave
- 622 3rd Ave
- 2463 Steamboat Valley Rd
- 342 4th Ave
- 0 Apple Valley Rd
- 450 Vasquez Ct
- 105 Eagle Canyon Cir
- 618 Overlook Dr
- 219 Ewald Ave
- 2450 Eagle Ridge Rd
- 119 Eagle Canyon Cir
- 2615 Eagle Ridge Rd
- 2685 Eagle Ridge Rd
- 117 Eagle Valley Dr
- 223 Stone Canyon Rd
- 121 Osprey Ln