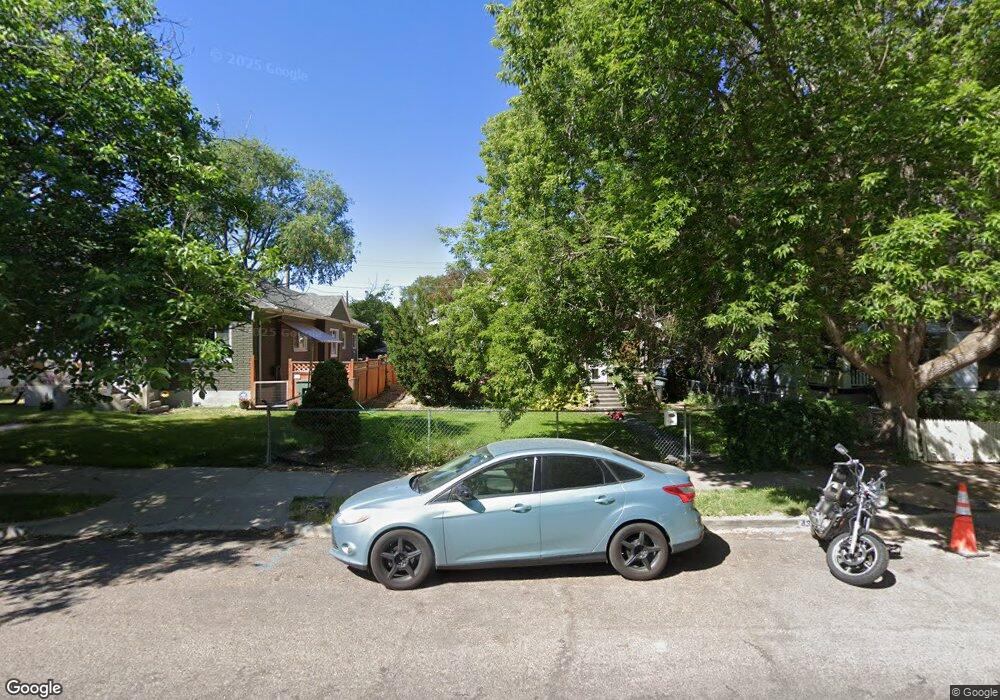
435 S 10th Ave Pocatello, ID 83201
Downtown Pocatello NeighborhoodEstimated Value: $313,000 - $397,000
4
Beds
2
Baths
2,162
Sq Ft
$161/Sq Ft
Est. Value
About This Home
This home is located at 435 S 10th Ave, Pocatello, ID 83201 and is currently estimated at $348,503, approximately $161 per square foot. 435 S 10th Ave is a home located in Bannock County with nearby schools including Washington Elementary School, Irving Middle School, and Century High School.
Ownership History
Date
Name
Owned For
Owner Type
Purchase Details
Closed on
Sep 15, 2017
Sold by
Bowman Melissa Ann and Bowman David
Bought by
Bowman David
Current Estimated Value
Home Financials for this Owner
Home Financials are based on the most recent Mortgage that was taken out on this home.
Original Mortgage
$157,003
Outstanding Balance
$133,165
Interest Rate
4.5%
Mortgage Type
FHA
Estimated Equity
$215,338
Purchase Details
Closed on
Jun 11, 2010
Sold by
Jenssen Jonathan
Bought by
Stuart Debbie R
Home Financials for this Owner
Home Financials are based on the most recent Mortgage that was taken out on this home.
Original Mortgage
$105,520
Interest Rate
5.03%
Mortgage Type
New Conventional
Purchase Details
Closed on
Dec 19, 2008
Sold by
Jensen Joanthan S and Jensen Melissa J
Bought by
Jensen Joanthan
Home Financials for this Owner
Home Financials are based on the most recent Mortgage that was taken out on this home.
Original Mortgage
$50,600
Interest Rate
6.03%
Mortgage Type
New Conventional
Create a Home Valuation Report for This Property
The Home Valuation Report is an in-depth analysis detailing your home's value as well as a comparison with similar homes in the area
Home Values in the Area
Average Home Value in this Area
Purchase History
| Date | Buyer | Sale Price | Title Company |
|---|---|---|---|
| Bowman David | -- | First American Title | |
| Bowman David | -- | First American Title Co | |
| Stuart Debbie R | -- | -- | |
| Jensen Joanthan | -- | -- |
Source: Public Records
Mortgage History
| Date | Status | Borrower | Loan Amount |
|---|---|---|---|
| Open | Bowman David | $157,003 | |
| Previous Owner | Stuart Debbie R | $105,520 | |
| Previous Owner | Jensen Joanthan | $50,600 |
Source: Public Records
Tax History Compared to Growth
Tax History
| Year | Tax Paid | Tax Assessment Tax Assessment Total Assessment is a certain percentage of the fair market value that is determined by local assessors to be the total taxable value of land and additions on the property. | Land | Improvement |
|---|---|---|---|---|
| 2024 | $1,703 | $243,728 | $74,000 | $169,728 |
| 2023 | $1,519 | $271,138 | $74,000 | $197,138 |
| 2022 | $1,519 | $178,191 | $26,460 | $151,731 |
| 2021 | $1,528 | $178,191 | $26,460 | $151,731 |
| 2020 | $1,244 | $155,270 | $26,460 | $128,810 |
| 2019 | $1,494 | $152,211 | $21,168 | $131,043 |
| 2018 | $1,367 | $121,278 | $18,900 | $102,378 |
| 2017 | $437 | $121,278 | $18,900 | $102,378 |
| 2016 | $286 | $121,278 | $18,900 | $102,378 |
| 2015 | $199 | $0 | $0 | $0 |
| 2012 | -- | $121,202 | $18,900 | $102,302 |
Source: Public Records
Map
Nearby Homes
- 355 S 11th Ave
- 426 S 8th Ave
- 330 S 7th Ave
- 937 E Lewis St
- 856 E Carter St
- 209 S 13th Ave
- 230 S 13th Ave
- 120 S 12th Ave
- 315 S 6th Ave
- 137 N 8th Ave
- 920 E Clark St
- 1226 E Clark St
- 1250 E Clark St
- 241 N 11th Ave
- 138 & 138 1/2 N 13th
- 1326 E Clark St
- Lot 20 Block 2 E Lander St
- Lot 19 Block 2 E Lander St
- Lot 14 Block 2 E Lander St
- Lot 15 Block 2 E Lander St
- 449 S 10th Ave
- 431 S 10th Ave
- 1048 E Benton St
- 415 S 10th Ave
- 426 S 9th Ave
- 446 S 9th Ave
- 1035 E Whitman St
- 1000 E Benton St
- 403 S 10th Ave
- 434 S 10th Ave
- 505 S 10th Ave
- 444 S 10th Ave
- 428 S 10th Ave
- 1025 E Benton St
- 1037 E Benton St
- 450 S 10th Ave
- 420 S 10th Ave
- 515 S 10th Ave
- 422 S 9th Ave
- 1021 E Whitman St