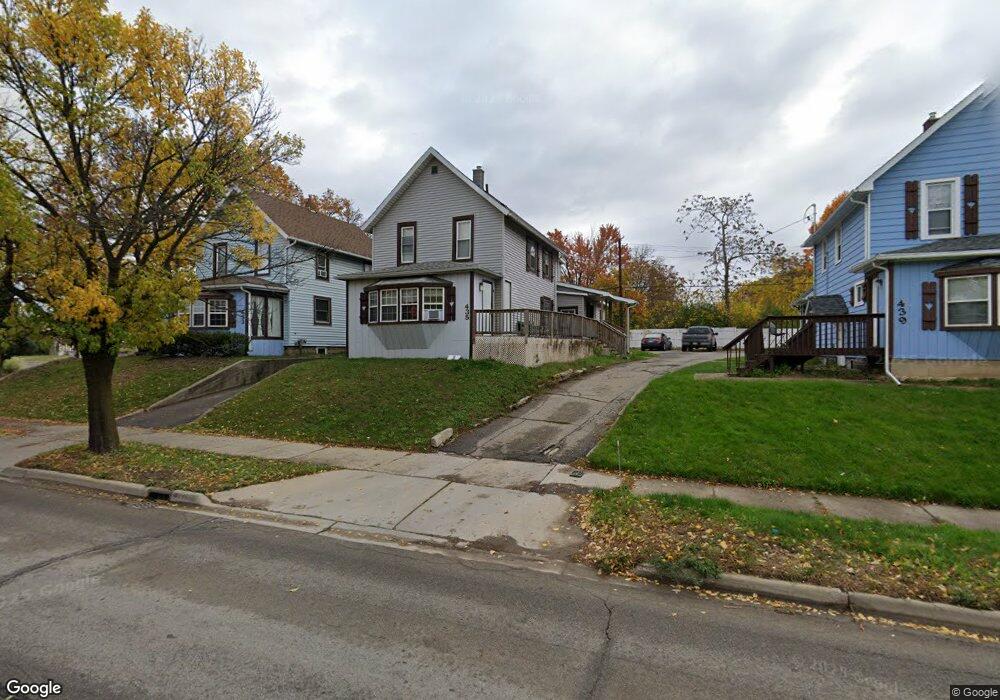
435 S Cedar St Lansing, MI 48912
The Stadium District NeighborhoodEstimated Value: $96,000 - $133,000
2
Beds
2
Baths
1,444
Sq Ft
$82/Sq Ft
Est. Value
About This Home
This home is located at 435 S Cedar St, Lansing, MI 48912 and is currently estimated at $119,000, approximately $82 per square foot. 435 S Cedar St is a home located in Ingham County with nearby schools including Riddle Elementary School, Pattengill Academy, and Eastern Lansing High School.
Ownership History
Date
Name
Owned For
Owner Type
Purchase Details
Closed on
Oct 7, 2020
Sold by
Mid Michigan Recovery Services Inc
Bought by
Mid Michigan Recovery Services Inc
Current Estimated Value
Home Financials for this Owner
Home Financials are based on the most recent Mortgage that was taken out on this home.
Original Mortgage
$269,600
Outstanding Balance
$239,795
Interest Rate
2.9%
Mortgage Type
Credit Line Revolving
Estimated Equity
-$120,795
Purchase Details
Closed on
Jul 29, 2020
Sold by
Parker Nancy K and Ballou Carolyn S
Bought by
Mid Michigan Recovery Services
Purchase Details
Closed on
Aug 7, 2015
Sold by
Parker Nancy K and Ballou Carolyn S
Bought by
Parker Nancy K and Ballou Carolyn S
Purchase Details
Closed on
Apr 27, 2012
Sold by
City Rescue Mission Of Lansing
Bought by
Parker Nancy K and Ballou Carolyn S
Create a Home Valuation Report for This Property
The Home Valuation Report is an in-depth analysis detailing your home's value as well as a comparison with similar homes in the area
Home Values in the Area
Average Home Value in this Area
Purchase History
| Date | Buyer | Sale Price | Title Company |
|---|---|---|---|
| Mid Michigan Recovery Services Inc | -- | None Available | |
| Mid Michigan Recovery Services | $400,000 | Transnation Title Agency | |
| Parker Nancy K | -- | None Available | |
| Parker Nancy K | $150,000 | Midstate Title Agency Llc |
Source: Public Records
Mortgage History
| Date | Status | Borrower | Loan Amount |
|---|---|---|---|
| Open | Mid Michigan Recovery Services Inc | $269,600 |
Source: Public Records
Tax History Compared to Growth
Tax History
| Year | Tax Paid | Tax Assessment Tax Assessment Total Assessment is a certain percentage of the fair market value that is determined by local assessors to be the total taxable value of land and additions on the property. | Land | Improvement |
|---|---|---|---|---|
| 2025 | $125 | $0 | $0 | $0 |
| 2024 | $122 | $0 | $0 | $0 |
| 2023 | $122 | $0 | $0 | $0 |
| 2022 | $119 | $0 | $0 | $0 |
| 2021 | $117 | $36,400 | $2,500 | $33,900 |
| 2020 | $1,996 | $36,400 | $2,500 | $33,900 |
| 2019 | $1,885 | $31,600 | $2,500 | $29,100 |
| 2018 | $1,511 | $24,000 | $2,500 | $21,500 |
| 2017 | $1,453 | $24,000 | $2,500 | $21,500 |
| 2016 | $1,335 | $23,600 | $2,500 | $21,100 |
| 2015 | $1,335 | $22,800 | $5,012 | $17,788 |
| 2014 | $1,335 | $22,300 | $5,012 | $17,288 |
Source: Public Records
Map
Nearby Homes
- 518 Beech St
- 506 S East St
- 816 Hickory St
- 811 Larned St
- 205 Hill St
- 621 S Grand Ave Unit 8
- 302 S 8th St
- 209 S Hosmer St
- 207 S Hosmer St
- 500 E Michigan Ave Unit 415
- 911 E Kalamazoo St
- 917 E Kalamazoo St
- 212 S 8th St
- 917 Prospect St
- 130 S 8th St
- 1018 E Kalamazoo St
- 1100 Hickory St
- 214 S Washington Square Unit 2
- 1029 Clear St
- 1128 Hickory St