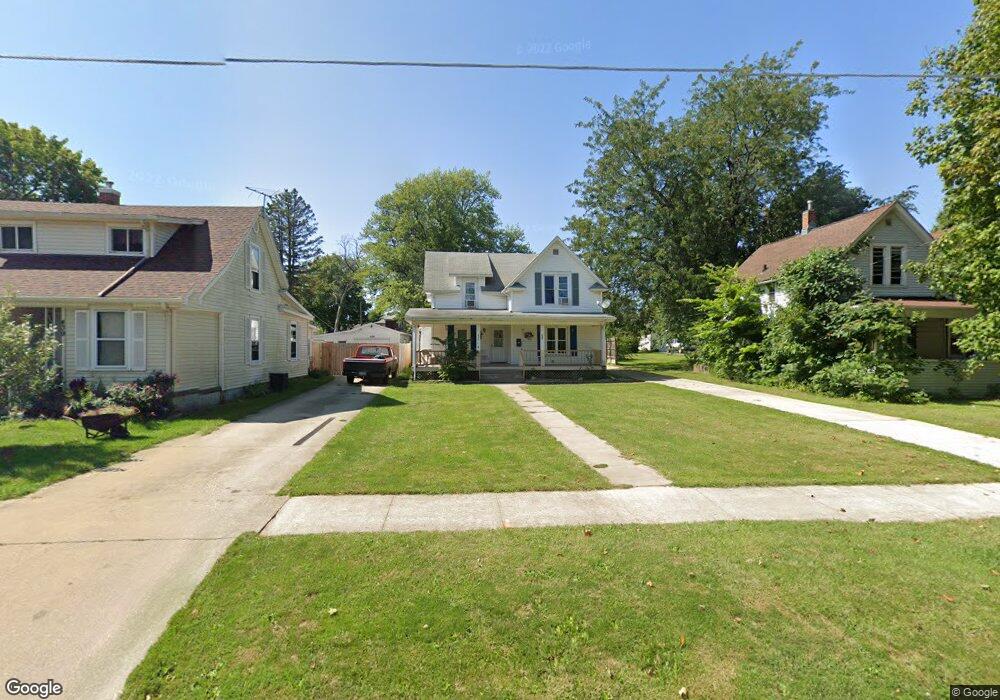
435 S Grove St Kewanee, IL 61443
Estimated Value: $83,000 - $96,000
4
Beds
--
Bath
1,526
Sq Ft
$58/Sq Ft
Est. Value
About This Home
This home is located at 435 S Grove St, Kewanee, IL 61443 and is currently estimated at $88,929, approximately $58 per square foot. 435 S Grove St is a home located in Henry County with nearby schools including Kewanee High School and Visitation Catholic School.
Ownership History
Date
Name
Owned For
Owner Type
Purchase Details
Closed on
Jul 29, 2019
Sold by
Ensley Chad M and Ensley Allison L
Bought by
Avilez Ramirez Lorenzo and Morales Masanjuana Morado
Current Estimated Value
Home Financials for this Owner
Home Financials are based on the most recent Mortgage that was taken out on this home.
Original Mortgage
$76,262
Outstanding Balance
$67,357
Interest Rate
4.12%
Estimated Equity
$21,572
Purchase Details
Closed on
Jun 22, 2006
Sold by
Petty Robert D and Petty Karen A
Bought by
Ensley Chad M
Home Financials for this Owner
Home Financials are based on the most recent Mortgage that was taken out on this home.
Original Mortgage
$75,001
Interest Rate
6.72%
Mortgage Type
New Conventional
Purchase Details
Closed on
Apr 15, 2005
Sold by
Heaton Jack H and Heaton Kathryn
Bought by
Petty Robert D and Petty Karen A
Create a Home Valuation Report for This Property
The Home Valuation Report is an in-depth analysis detailing your home's value as well as a comparison with similar homes in the area
Home Values in the Area
Average Home Value in this Area
Purchase History
| Date | Buyer | Sale Price | Title Company |
|---|---|---|---|
| Avilez Ramirez Lorenzo | $75,500 | Western Illinois Title | |
| Ensley Chad M | $71,500 | None Available | |
| Petty Robert D | -- | None Available |
Source: Public Records
Mortgage History
| Date | Status | Borrower | Loan Amount |
|---|---|---|---|
| Open | Avilez Ramirez Lorenzo | $76,262 | |
| Previous Owner | Ensley Chad M | $75,001 |
Source: Public Records
Tax History
| Year | Tax Paid | Tax Assessment Tax Assessment Total Assessment is a certain percentage of the fair market value that is determined by local assessors to be the total taxable value of land and additions on the property. | Land | Improvement |
|---|---|---|---|---|
| 2024 | $1,707 | $21,810 | $1,279 | $20,531 |
| 2023 | $1,475 | $19,301 | $1,132 | $18,169 |
| 2022 | $1,302 | $17,562 | $1,030 | $16,532 |
| 2021 | $1,194 | $16,261 | $954 | $15,307 |
| 2020 | $1,157 | $15,903 | $933 | $14,970 |
| 2019 | $1,207 | $16,592 | $973 | $15,619 |
| 2018 | $1,182 | $16,289 | $997 | $15,292 |
| 2017 | $1,154 | $16,080 | $984 | $15,096 |
| 2016 | $1,172 | $16,242 | $994 | $15,248 |
| 2015 | $1,241 | $15,970 | $977 | $14,993 |
| 2013 | $1,241 | $16,377 | $1,002 | $15,375 |
Source: Public Records
Map
Nearby Homes
- 512 Commercial St
- 702 Elliott St Unit 1
- 110 N Park St
- 215 W Prospect St
- 1205 Roseview Ave
- 122 Beach St S
- 716 W 3rd St
- 136 W Mill St
- 422 Ross St
- 714 S Main St
- 732 S Main St
- 236 W Church St
- 124 E Mill St
- 716 Morton Ave
- 328 E Prospect St
- 337 Whitney Ave
- 416 Payson St
- 0 N Main St Unit E 2nd
- 436 Hollis St
- 116 W Garfield St
Your Personal Tour Guide
Ask me questions while you tour the home.