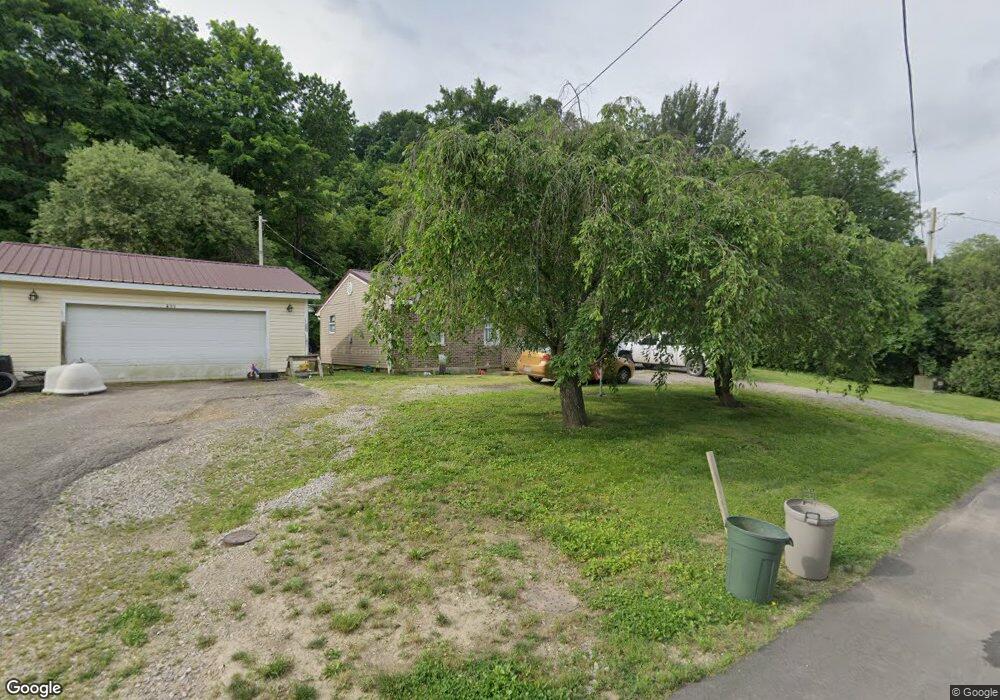
435 S Maple St Bainbridge, OH 45612
Estimated Value: $133,000 - $173,056
3
Beds
1
Bath
1,300
Sq Ft
$119/Sq Ft
Est. Value
About This Home
This home is located at 435 S Maple St, Bainbridge, OH 45612 and is currently estimated at $155,264, approximately $119 per square foot. 435 S Maple St is a home located in Ross County with nearby schools including Paint Valley Elementary School, Paint Valley Middle School, and Paint Valley High School.
Ownership History
Date
Name
Owned For
Owner Type
Purchase Details
Closed on
Feb 4, 2021
Sold by
Hamlin Andrea
Bought by
Hamlin Troy
Current Estimated Value
Purchase Details
Closed on
Mar 23, 2015
Sold by
Lytle Bertha
Bought by
Hamlin Troy and Hamlin Andrea
Home Financials for this Owner
Home Financials are based on the most recent Mortgage that was taken out on this home.
Original Mortgage
$59,693
Outstanding Balance
$45,515
Interest Rate
3.56%
Estimated Equity
$109,749
Create a Home Valuation Report for This Property
The Home Valuation Report is an in-depth analysis detailing your home's value as well as a comparison with similar homes in the area
Purchase History
| Date | Buyer | Sale Price | Title Company |
|---|---|---|---|
| Hamlin Troy | -- | None Available | |
| Hamlin Troy | -- | Northwest Title Agency |
Source: Public Records
Mortgage History
| Date | Status | Borrower | Loan Amount |
|---|---|---|---|
| Open | Hamlin Troy | $59,693 |
Source: Public Records
Tax History
| Year | Tax Paid | Tax Assessment Tax Assessment Total Assessment is a certain percentage of the fair market value that is determined by local assessors to be the total taxable value of land and additions on the property. | Land | Improvement |
|---|---|---|---|---|
| 2024 | $1,588 | $39,120 | $4,150 | $34,970 |
| 2023 | $1,588 | $39,120 | $4,150 | $34,970 |
| 2022 | $1,595 | $39,120 | $4,150 | $34,970 |
| 2021 | $1,395 | $31,070 | $3,270 | $27,800 |
| 2020 | $1,394 | $31,070 | $3,270 | $27,800 |
| 2019 | $1,416 | $31,070 | $3,270 | $27,800 |
| 2018 | $1,299 | $28,820 | $3,010 | $25,810 |
| 2017 | $1,330 | $29,460 | $3,010 | $26,450 |
| 2016 | $1,301 | $29,460 | $3,010 | $26,450 |
| 2015 | $1,234 | $28,490 | $3,010 | $25,480 |
| 2014 | $813 | $28,490 | $3,010 | $25,480 |
| 2013 | $825 | $28,490 | $3,010 | $25,480 |
Source: Public Records
Map
Nearby Homes
- 500 S Quarry St
- 119 Shawnee St
- 304 E 2nd St
- 116 E 3rd St
- 316 W Main St
- 4790 Jester Hill Rd
- 329 Kinzer Rd
- 5957 Greenbriar Rd
- 1314 U S 50
- 1314 US Highway 50 W
- 4511 Potts Hill Rd
- 560 Landrum Rd
- 839 Falls Rd
- 0 E Sd Benner Oh Unit 225046180
- 0 Potts Hill Rd Unit 225030231
- 0 Potts Hill Rd Unit 225030226
- 201 Pike Lake Rd Unit (Tract 3 Barn Pike L
- 201 Pike Lake Rd
- 27 Pike Lake Rd
- 0 Upper Twin Rd Unit 226009082
- 435 S Maple St Unit END
- 434 S Maple St
- 433 S Maple St
- 436 S Maple St
- 440 S Quarry St
- 418 S Maple St
- 414 S Maple St
- 408 S Maple St
- 241 S Quarry St
- 237 S Quarry St
- 8192 S Quarry St
- 405 S Maple St
- 6136 Jester Hill Rd
- 0 E Jester Hill Rd Unit 1427020
- 0 E Jester Hill Rd Unit 184837
- 0 E Jester Hill Rd Unit 167317
- 0 E Jester Hill Rd Unit 147299
- 0 E Jester Hill Rd Unit 187071
- 0 E Jester Hill Rd Unit 1632984
- 106 Dewey St
Your Personal Tour Guide
Ask me questions while you tour the home.