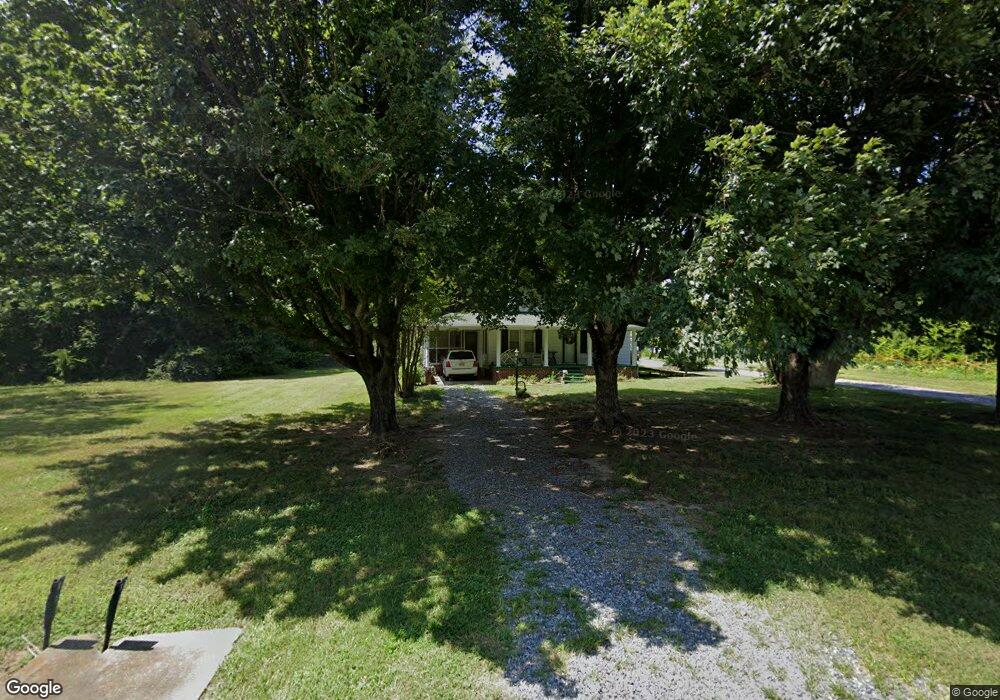
435 Saint Marks Church Rd Bessemer City, NC 28016
Estimated Value: $254,000 - $270,129
3
Beds
1
Bath
1,378
Sq Ft
$189/Sq Ft
Est. Value
About This Home
This home is located at 435 Saint Marks Church Rd, Bessemer City, NC 28016 and is currently estimated at $261,032, approximately $189 per square foot. 435 Saint Marks Church Rd is a home located in Gaston County with nearby schools including Cherryville Elementary School, William B. Beam Intermediate School, and John Chavis Middle School.
Ownership History
Date
Name
Owned For
Owner Type
Purchase Details
Closed on
Jul 2, 2025
Sold by
Gates Dale Eldon and Gates Lori
Bought by
Beam Macie
Current Estimated Value
Home Financials for this Owner
Home Financials are based on the most recent Mortgage that was taken out on this home.
Original Mortgage
$247,350
Outstanding Balance
$246,932
Interest Rate
6.86%
Mortgage Type
New Conventional
Estimated Equity
$14,100
Purchase Details
Closed on
May 6, 2024
Sold by
Betty Helton Gates Irrevocable Trust and Gates Dale Eldon
Bought by
Gates Dale Eldon and Brown Jill Gates
Purchase Details
Closed on
Apr 14, 2021
Sold by
Gates Dale Eldon and Gates Lori
Bought by
Gates Dale Eldon and Brown Jill Gates
Purchase Details
Closed on
Apr 26, 2002
Sold by
Gates Betty Ruth Helton and Gates Charles Eldon
Bought by
Gates Dale E and Brown Jill G
Create a Home Valuation Report for This Property
The Home Valuation Report is an in-depth analysis detailing your home's value as well as a comparison with similar homes in the area
Home Values in the Area
Average Home Value in this Area
Purchase History
| Date | Buyer | Sale Price | Title Company |
|---|---|---|---|
| Beam Macie | $255,000 | None Listed On Document | |
| Gates Dale Eldon | -- | None Listed On Document | |
| Gates Dale Eldon | -- | None Listed On Document | |
| Gates Dale Eldon | -- | None Available | |
| Gates Dale E | -- | -- |
Source: Public Records
Mortgage History
| Date | Status | Borrower | Loan Amount |
|---|---|---|---|
| Open | Beam Macie | $247,350 |
Source: Public Records
Tax History Compared to Growth
Tax History
| Year | Tax Paid | Tax Assessment Tax Assessment Total Assessment is a certain percentage of the fair market value that is determined by local assessors to be the total taxable value of land and additions on the property. | Land | Improvement |
|---|---|---|---|---|
| 2025 | $1,319 | $184,730 | $17,500 | $167,230 |
| 2024 | $1,319 | $184,730 | $17,500 | $167,230 |
| 2023 | $1,284 | $184,730 | $17,500 | $167,230 |
| 2022 | $978 | $106,300 | $15,000 | $91,300 |
| 2021 | $990 | $106,300 | $15,000 | $91,300 |
| 2019 | $979 | $106,300 | $15,000 | $91,300 |
| 2018 | $789 | $81,735 | $16,000 | $65,735 |
| 2017 | $780 | $81,735 | $16,000 | $65,735 |
| 2016 | $780 | $81,735 | $0 | $0 |
| 2014 | $768 | $80,844 | $20,000 | $60,844 |
Source: Public Records
Map
Nearby Homes
- 547 Saint Marks Church Rd
- 1756 Martin Rd
- 5533 Harvest Hills Rd
- 101 Greenway Ave
- 2198 County Line Rd
- 130 Inglebrook Ln
- 000 Lawrence Rd
- 264 Mauney Farm Rd
- 1015 E Academy St
- 0000 Dallas Cherryville Hwy
- 253 Suncrest Rd
- 692 S Pink St
- 215 Suncrest Rd
- 327 J C Dellinger Rd
- 404 Kings Dr
- 323 J C Dellinger Rd
- 600 Queens Rd
- 130 Sunnyside Shady Rest Rd
- 106 Guffey Rd
- 334 S Pink St
- 2962 Tryon Courthouse Rd
- 500 Saint Marks Church Rd
- 544 Saint Marks Church Rd
- 407 Saint Marks Church Rd
- 427 Saint Marks Church Rd
- 443 Saint Marks Church Rd
- - St Marks Church Rd
- 448 Saint Marks Church Rd
- 119 Circle s Dr
- 141 Circle s Dr
- 113 Circle s Dr
- 531 Saint Marks Church Rd
- 546 Saint Marks Church Rd
- 426 Saint Marks Church Rd
- 414 Saint Marks Church Rd
- 604 Saint Marks Church Rd
- 2934 Tryon Courthouse Rd
- 2918 Tryon Courthouse Rd
- 541 Saint Marks Church Rd
- 2912 Tryon Courthouse Rd