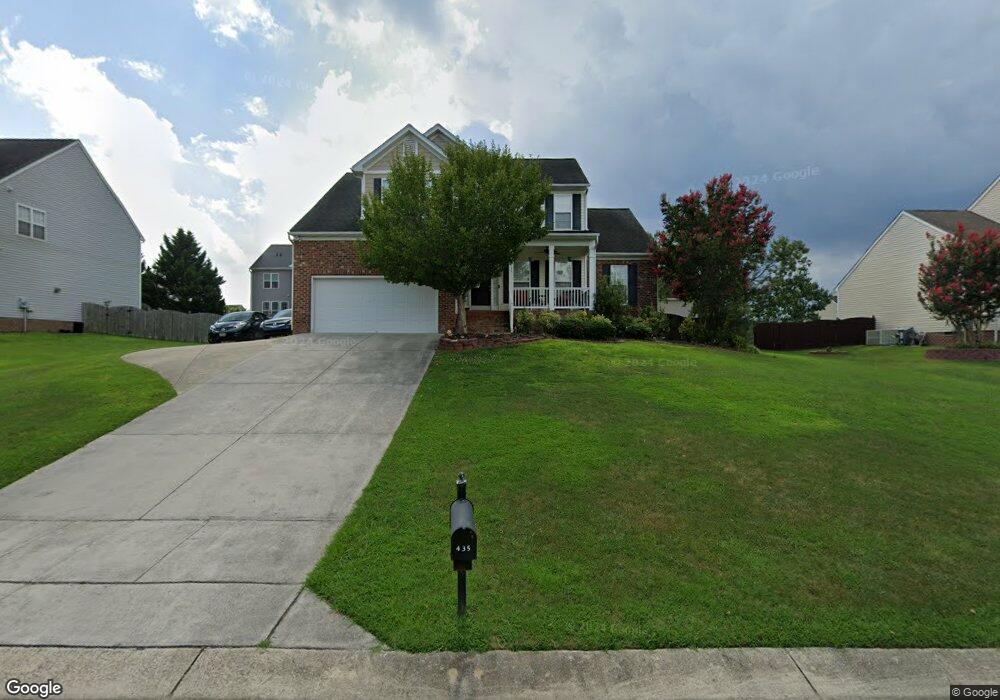
435 Shady Willow Ln Unit Lt 89 Rolesville, NC 27571
Estimated Value: $458,000 - $497,000
5
Beds
4
Baths
2,627
Sq Ft
$184/Sq Ft
Est. Value
About This Home
This home is located at 435 Shady Willow Ln Unit Lt 89, Rolesville, NC 27571 and is currently estimated at $483,115, approximately $183 per square foot. 435 Shady Willow Ln Unit Lt 89 is a home located in Wake County with nearby schools including Sanford Creek Elementary School, Rolesville Middle School, and Rolesville High School.
Ownership History
Date
Name
Owned For
Owner Type
Purchase Details
Closed on
May 16, 2017
Sold by
Stone Financing Llc
Bought by
Amh Nc Properties Lp
Current Estimated Value
Purchase Details
Closed on
Mar 27, 2017
Sold by
Diggs Walter J and Diggs Michelel M
Bought by
Stone Fincancing Llc
Purchase Details
Closed on
Oct 15, 2013
Sold by
Mcclafferty Shawn P and Mcclafferty Sandra
Bought by
Diggs Walter J and Diggs Michelle M
Home Financials for this Owner
Home Financials are based on the most recent Mortgage that was taken out on this home.
Original Mortgage
$260,316
Interest Rate
4.53%
Mortgage Type
VA
Purchase Details
Closed on
May 8, 2008
Sold by
Jordans Construction Inc
Bought by
Wells Sandra L and Mcclafferty Shawn P
Home Financials for this Owner
Home Financials are based on the most recent Mortgage that was taken out on this home.
Original Mortgage
$260,606
Interest Rate
5.82%
Mortgage Type
FHA
Create a Home Valuation Report for This Property
The Home Valuation Report is an in-depth analysis detailing your home's value as well as a comparison with similar homes in the area
Home Values in the Area
Average Home Value in this Area
Purchase History
| Date | Buyer | Sale Price | Title Company |
|---|---|---|---|
| Amh Nc Properties Lp | $264,000 | None Available | |
| Stone Fincancing Llc | $264,000 | None Available | |
| Diggs Walter J | $252,000 | None Available | |
| Wells Sandra L | $263,000 | None Available |
Source: Public Records
Mortgage History
| Date | Status | Borrower | Loan Amount |
|---|---|---|---|
| Previous Owner | Diggs Walter J | $260,316 | |
| Previous Owner | Wells Sandra L | $260,606 |
Source: Public Records
Tax History Compared to Growth
Tax History
| Year | Tax Paid | Tax Assessment Tax Assessment Total Assessment is a certain percentage of the fair market value that is determined by local assessors to be the total taxable value of land and additions on the property. | Land | Improvement |
|---|---|---|---|---|
| 2025 | $4,702 | $477,854 | $110,000 | $367,854 |
| 2024 | $4,685 | $477,854 | $110,000 | $367,854 |
| 2023 | $3,274 | $291,301 | $44,000 | $247,301 |
| 2022 | $3,165 | $291,301 | $44,000 | $247,301 |
| 2021 | $3,372 | $291,301 | $44,000 | $247,301 |
| 2020 | $3,108 | $291,301 | $44,000 | $247,301 |
| 2019 | $3,071 | $254,127 | $48,000 | $206,127 |
| 2018 | $2,903 | $254,127 | $48,000 | $206,127 |
| 2017 | $2,803 | $254,127 | $48,000 | $206,127 |
| 2016 | $2,766 | $254,127 | $48,000 | $206,127 |
| 2015 | $2,991 | $281,776 | $45,000 | $236,776 |
| 2014 | $2,888 | $281,776 | $45,000 | $236,776 |
Source: Public Records
Map
Nearby Homes
- 824 Willow Tower Ct
- 825 Willow Tower Ct
- 821 Willow Tower Ct
- 1036 Smoke Willow Way
- 1021 Smoke Willow Way Unit 130
- 452 Granite Saddle Dr
- 418 Granite Creek Dr
- 432 Golden Dragonfly St
- 436 Golden Dragonfly St
- 440 Golden Dragonfly St
- 444 Golden Dragonfly St
- 448 Golden Dragonfly St
- 452 Golden Dragonfly St
- 459 Granite Creek Dr
- 3004 Freeman Farm Way
- 1200 Granite Falls Blvd
- 5508 Massey Branch Dr
- 1117 Dartford Green Place
- 536 Adkins Ridge Rd
- 1001 Kennison Ct
- 435 Shady Willow Ln
- 441 Shady Willow Ln
- 431 Shady Willow Ln
- 530 Misty Willow Way
- 526 Misty Willow Way
- 434 Shady Willow Ln
- 438 Shady Willow Ln
- 534 Misty Willow Way
- 445 Shady Willow Ln
- 522 Misty Willow Way
- 425 Shady Willow Ln
- 155 Misty Willow Way
- 430 Shady Willow Ln
- 430 Shady Willow Ln Unit Lt100
- 442 Shady Willow Ln
- 442 Shady Willow Ln Unit Lt 97
- 538 Misty Willow Way
- 426 Shady Willow Ln
- 518 Misty Willow Way
- 446 Shady Willow Ln