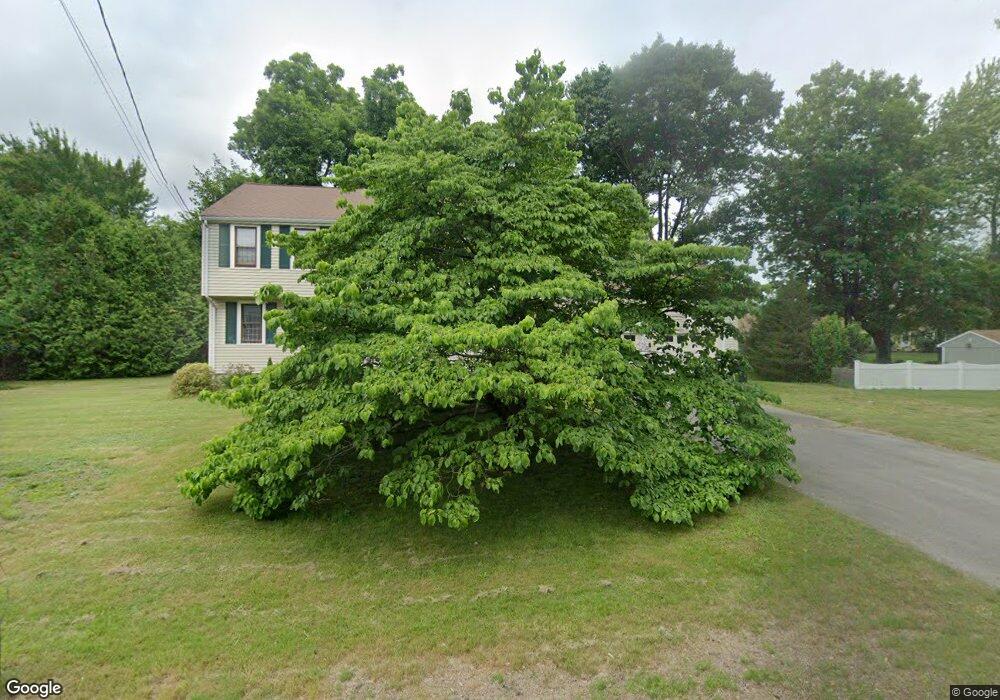
435 Sumner St Norwood, MA 02062
South Norwood NeighborhoodEstimated Value: $875,707 - $1,035,000
4
Beds
3
Baths
2,156
Sq Ft
$438/Sq Ft
Est. Value
About This Home
This home is located at 435 Sumner St, Norwood, MA 02062 and is currently estimated at $945,177, approximately $438 per square foot. 435 Sumner St is a home located in Norfolk County with nearby schools including Norwood High School and Norwood Montessori School.
Ownership History
Date
Name
Owned For
Owner Type
Purchase Details
Closed on
Oct 5, 2023
Sold by
Tatar Fred W
Bought by
Tatar Fred W and Egan Jane M
Current Estimated Value
Purchase Details
Closed on
Aug 3, 1987
Sold by
Bucci Vincent N
Bought by
Tatar Fred W
Home Financials for this Owner
Home Financials are based on the most recent Mortgage that was taken out on this home.
Original Mortgage
$40,000
Interest Rate
10.43%
Mortgage Type
Purchase Money Mortgage
Create a Home Valuation Report for This Property
The Home Valuation Report is an in-depth analysis detailing your home's value as well as a comparison with similar homes in the area
Home Values in the Area
Average Home Value in this Area
Purchase History
| Date | Buyer | Sale Price | Title Company |
|---|---|---|---|
| Tatar Fred W | -- | None Available | |
| Tatar Fred W | $240,000 | -- |
Source: Public Records
Mortgage History
| Date | Status | Borrower | Loan Amount |
|---|---|---|---|
| Previous Owner | Tatar Fred W | $40,000 |
Source: Public Records
Tax History
| Year | Tax Paid | Tax Assessment Tax Assessment Total Assessment is a certain percentage of the fair market value that is determined by local assessors to be the total taxable value of land and additions on the property. | Land | Improvement |
|---|---|---|---|---|
| 2025 | $88 | $839,300 | $340,100 | $499,200 |
| 2024 | $8,519 | $813,700 | $340,100 | $473,600 |
| 2023 | $7,689 | $745,100 | $280,900 | $464,200 |
| 2022 | $7,166 | $666,600 | $255,400 | $411,200 |
| 2021 | $6,829 | $602,200 | $246,100 | $356,100 |
| 2020 | $6,809 | $610,700 | $244,000 | $366,700 |
| 2019 | $6,064 | $556,800 | $236,500 | $320,300 |
| 2018 | $6,077 | $548,000 | $237,000 | $311,000 |
| 2017 | $6,110 | $548,000 | $237,000 | $311,000 |
| 2016 | $5,758 | $517,800 | $237,000 | $280,800 |
| 2015 | $5,802 | $505,800 | $215,400 | $290,400 |
| 2014 | $5,485 | $473,700 | $203,500 | $270,200 |
Source: Public Records
Map
Nearby Homes
- Unit 11 Powder House Ln Unit 11
- 8 Powder House Ln Unit 2
- Unit 12 Powder House Ln Unit 12
- Unit 3 Powder House Ln Unit 3
- 7 Cape Club Dr Unit 9
- 38 Cape Club Dr Unit 38
- 40 Cape Club Dr Unit 40
- 0 Charlotte Rd
- 51-U:37 Cape Club Dr
- 33 Sumner St
- 120 Polley Ln
- 7 Washington Green
- 6 Orchard Dr
- 363 - 367 Washington St
- 40 Endean Dr
- 47 Orchard Hill Dr
- 3 York Cir
- 0 Quail Run
- 0 Deerfield Rd
- 26 Saint Josephs Ave
- 425 Sumner St
- 428 Sumner St
- 438 Sumner St
- 55 Liberty Ln
- 156 Rustic Rd
- 417 Sumner St
- 416 Sumner St
- 57 Independence Way
- 48 Liberty Ln
- 153 Rustic Rd
- 150 Rustic Rd
- 43 Liberty Ln
- 404 Sumner St
- 47 Independence Way
- 64 Independence Way
- 38 Liberty Ln
- 135 Rustic Rd
- 398 Sumner St
- 54 Independence Way
- 39 Independence Way
Your Personal Tour Guide
Ask me questions while you tour the home.