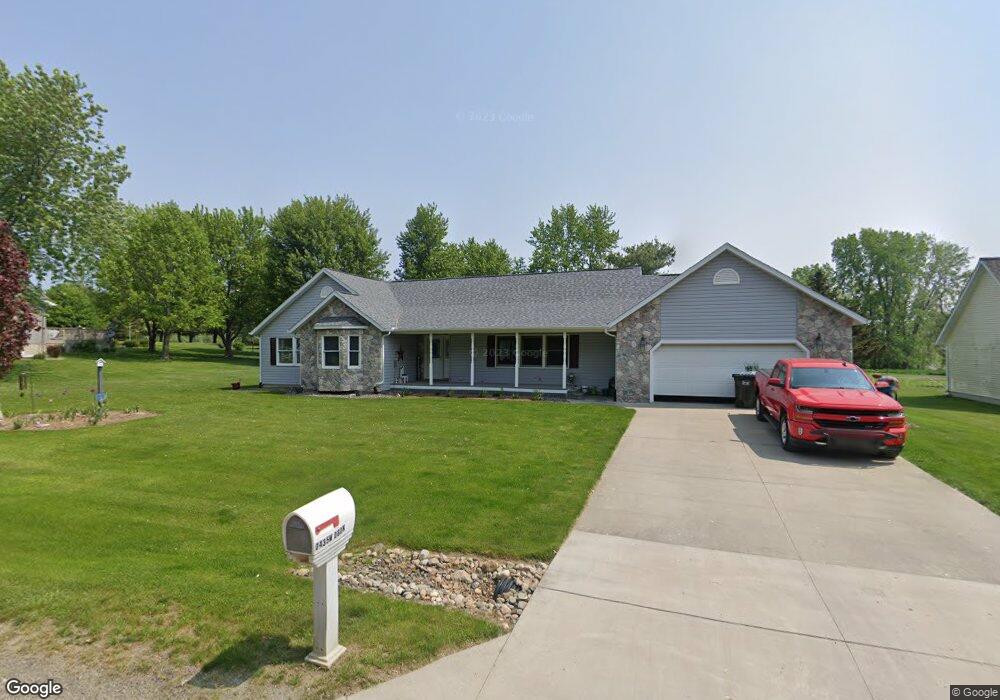
435 W 060 N Lagrange, IN 46761
Estimated Value: $317,000 - $423,000
3
Beds
3
Baths
2,112
Sq Ft
$178/Sq Ft
Est. Value
About This Home
This home is located at 435 W 060 N, Lagrange, IN 46761 and is currently estimated at $376,683, approximately $178 per square foot. 435 W 060 N is a home located in LaGrange County with nearby schools including Lakeland Jr/Sr High School, Southeast Clay School, and Countryside School.
Ownership History
Date
Name
Owned For
Owner Type
Purchase Details
Closed on
Oct 10, 2019
Sold by
Bowen Jean I
Bought by
Rumsey Steven E and Rumsey Merrilee S
Current Estimated Value
Home Financials for this Owner
Home Financials are based on the most recent Mortgage that was taken out on this home.
Original Mortgage
$145,000
Outstanding Balance
$111,810
Interest Rate
3.4%
Mortgage Type
Construction
Estimated Equity
$264,873
Purchase Details
Closed on
Mar 14, 2014
Sold by
Gerald A Ferro
Bought by
Jean I Bowen
Create a Home Valuation Report for This Property
The Home Valuation Report is an in-depth analysis detailing your home's value as well as a comparison with similar homes in the area
Home Values in the Area
Average Home Value in this Area
Purchase History
| Date | Buyer | Sale Price | Title Company |
|---|---|---|---|
| Rumsey Steven E | $255,000 | Attorney Only | |
| Jean I Bowen | $234,000 | Lakeland Title Company |
Source: Public Records
Mortgage History
| Date | Status | Borrower | Loan Amount |
|---|---|---|---|
| Open | Rumsey Steven E | $145,000 |
Source: Public Records
Tax History Compared to Growth
Tax History
| Year | Tax Paid | Tax Assessment Tax Assessment Total Assessment is a certain percentage of the fair market value that is determined by local assessors to be the total taxable value of land and additions on the property. | Land | Improvement |
|---|---|---|---|---|
| 2024 | $1,089 | $296,500 | $25,100 | $271,400 |
| 2023 | $914 | $273,400 | $24,400 | $249,000 |
| 2022 | $1,099 | $271,300 | $23,200 | $248,100 |
| 2021 | $1,017 | $257,100 | $21,100 | $236,000 |
| 2020 | $1,057 | $250,600 | $21,100 | $229,500 |
| 2019 | $1,096 | $254,800 | $21,100 | $233,700 |
| 2018 | $1,250 | $262,400 | $21,100 | $241,300 |
| 2017 | $1,152 | $244,100 | $19,300 | $224,800 |
| 2016 | $1,126 | $239,900 | $19,300 | $220,600 |
| 2014 | $1,104 | $236,600 | $19,300 | $217,300 |
| 2013 | $1,104 | $238,900 | $19,300 | $219,600 |
Source: Public Records
Map
Nearby Homes
- 415 W 060 N
- 0 Corner of Factory St & Townline Rd Unit 202541800
- 217 N Sherman St
- 915 N 015 E
- 914 S Detroit St
- 207 S Poplar St
- 737 N Canal St
- 306 N 100 E
- 245 E 100 S
- 1575 W 195 N
- 1400 N 200 E
- 2930 N 080 E
- 125 E Lot 10
- 3915 N 200 E
- 1030 N 400 E
- 4370 N 230 E
- 1510 Indiana 120
- 403 Williams St
- 5145 N 290 W
- 1770 W 570 N