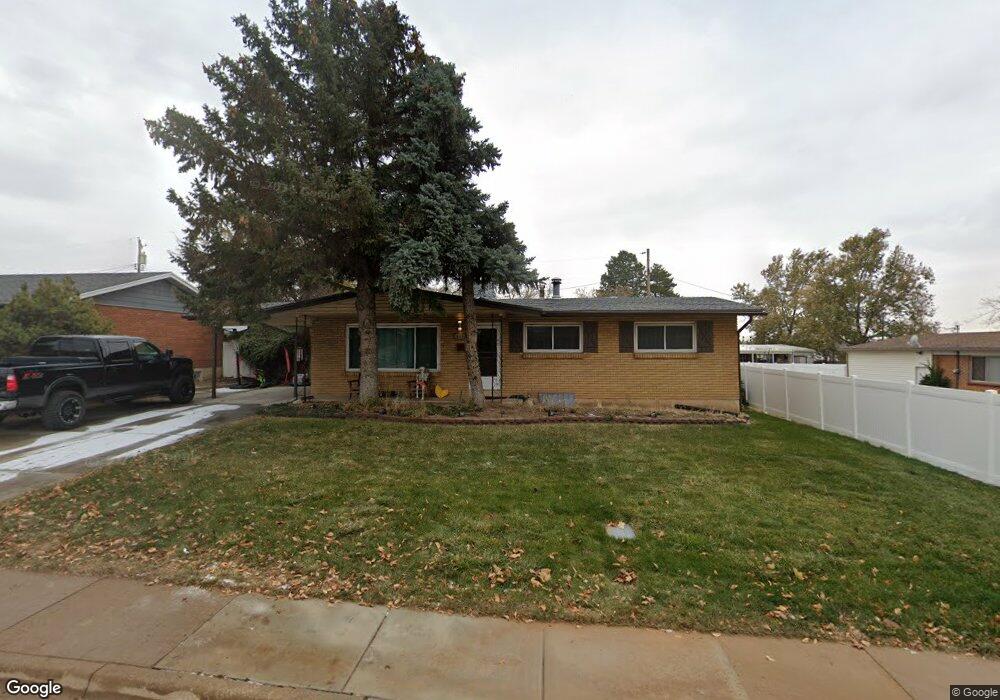
435 W 2250 N Clearfield, UT 84015
Estimated Value: $390,000 - $410,000
4
Beds
2
Baths
2,322
Sq Ft
$173/Sq Ft
Est. Value
About This Home
This home is located at 435 W 2250 N, Clearfield, UT 84015 and is currently estimated at $401,539, approximately $172 per square foot. 435 W 2250 N is a home located in Davis County with nearby schools including Sunset School, Sunset Junior High School, and Northridge High School.
Ownership History
Date
Name
Owned For
Owner Type
Purchase Details
Closed on
Mar 18, 2019
Sold by
The Lynn And Dorothy Weston Family Trust
Bought by
Gleason Lawrence P
Current Estimated Value
Home Financials for this Owner
Home Financials are based on the most recent Mortgage that was taken out on this home.
Original Mortgage
$240,895
Outstanding Balance
$211,358
Interest Rate
4.4%
Mortgage Type
VA
Estimated Equity
$190,181
Purchase Details
Closed on
Jan 18, 2012
Sold by
Weston Lynn P and Weston Dorothy L
Bought by
The Lynn & Dorothy Weston Family Trust and Weston Lynn P
Purchase Details
Closed on
Mar 10, 1980
Sold by
Cabrey Richard Edward and Cabrey Judith Ann
Bought by
Weston Lynn P and Weston Dorothy L
Create a Home Valuation Report for This Property
The Home Valuation Report is an in-depth analysis detailing your home's value as well as a comparison with similar homes in the area
Home Values in the Area
Average Home Value in this Area
Purchase History
| Date | Buyer | Sale Price | Title Company |
|---|---|---|---|
| Gleason Lawrence P | -- | First American Tit | |
| The Lynn & Dorothy Weston Family Trust | -- | None Available | |
| Weston Lynn P | -- | Associated Title Company |
Source: Public Records
Mortgage History
| Date | Status | Borrower | Loan Amount |
|---|---|---|---|
| Open | Gleason Lawrence P | $240,895 |
Source: Public Records
Tax History Compared to Growth
Tax History
| Year | Tax Paid | Tax Assessment Tax Assessment Total Assessment is a certain percentage of the fair market value that is determined by local assessors to be the total taxable value of land and additions on the property. | Land | Improvement |
|---|---|---|---|---|
| 2025 | $2,243 | $204,600 | $73,665 | $130,935 |
| 2024 | $2,188 | $199,650 | $70,417 | $129,233 |
| 2023 | $2,056 | $342,000 | $112,552 | $229,448 |
| 2022 | $2,303 | $207,351 | $64,433 | $142,918 |
| 2021 | $2,021 | $286,000 | $69,058 | $216,942 |
| 2020 | $1,761 | $245,000 | $58,200 | $186,800 |
| 2019 | $1,549 | $221,000 | $74,527 | $146,473 |
| 2018 | $1,260 | $176,000 | $59,558 | $116,442 |
| 2016 | $1,072 | $76,945 | $28,159 | $48,786 |
| 2015 | $1,044 | $71,005 | $28,159 | $42,846 |
| 2014 | $1,020 | $70,866 | $28,159 | $42,707 |
| 2013 | -- | $67,300 | $23,265 | $44,035 |
Source: Public Records
Map
Nearby Homes
- 2177 N 450 W
- 648 W 2200 N
- 2512 N 475 W
- 389 W 2575 N
- 2486 N 690 W
- 2382 N 770 W
- 2593 N 500 W Unit 56
- 350 W 2575 N
- 2612 N 525 W
- 2085 N Main St Unit 409
- 2085 N Main St Unit 108
- 2085 N Main St Unit 401
- 2085 N Main St Unit 308
- 2085 N Main St Unit 116
- 2085 N Main St Unit 201
- 2085 N Main St Unit 402
- 2085 N Main St Unit 202
- 2085 N Main St Unit 301
- 2085 N Main St Unit 302
- 2085 N Main St Unit 115