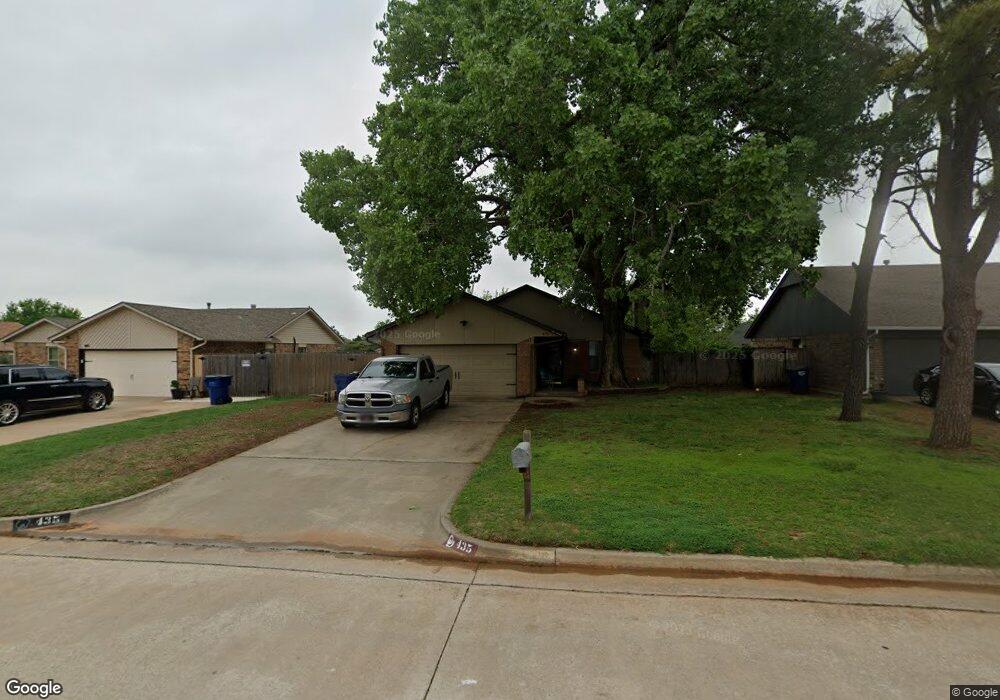
435 W Branches Way Mustang, OK 73064
Estimated Value: $178,000 - $181,511
3
Beds
2
Baths
1,032
Sq Ft
$174/Sq Ft
Est. Value
About This Home
This home is located at 435 W Branches Way, Mustang, OK 73064 and is currently estimated at $179,878, approximately $174 per square foot. 435 W Branches Way is a home located in Canadian County with nearby schools including Mustang Centennial Elementary School, Mustang Horizon Intermediate School, and Mustang Middle School.
Ownership History
Date
Name
Owned For
Owner Type
Purchase Details
Closed on
Oct 25, 2013
Sold by
Mayo Melvin and Mayo Deborah
Bought by
Nokes Shane R
Current Estimated Value
Home Financials for this Owner
Home Financials are based on the most recent Mortgage that was taken out on this home.
Original Mortgage
$98,188
Outstanding Balance
$74,342
Interest Rate
4.62%
Mortgage Type
FHA
Estimated Equity
$105,537
Purchase Details
Closed on
Dec 12, 2003
Sold by
Wolfe Christee
Home Financials for this Owner
Home Financials are based on the most recent Mortgage that was taken out on this home.
Original Mortgage
$57,975
Interest Rate
6.02%
Purchase Details
Closed on
Dec 18, 2002
Sold by
O'Steen Shelia
Purchase Details
Closed on
Apr 9, 1997
Sold by
O'Steen Bobby and O'Steen Shelia
Purchase Details
Closed on
Mar 5, 1993
Sold by
O'Steen Bobby Gene
Purchase Details
Closed on
Sep 20, 1990
Purchase Details
Closed on
Apr 2, 1990
Purchase Details
Closed on
Mar 14, 1989
Create a Home Valuation Report for This Property
The Home Valuation Report is an in-depth analysis detailing your home's value as well as a comparison with similar homes in the area
Home Values in the Area
Average Home Value in this Area
Purchase History
| Date | Buyer | Sale Price | Title Company |
|---|---|---|---|
| Nokes Shane R | $100,000 | Ort | |
| -- | -- | -- | |
| -- | -- | -- | |
| -- | -- | -- | |
| -- | -- | -- | |
| -- | -- | -- | |
| -- | -- | -- | |
| -- | $50,500 | -- |
Source: Public Records
Mortgage History
| Date | Status | Borrower | Loan Amount |
|---|---|---|---|
| Open | Nokes Shane R | $98,188 | |
| Previous Owner | -- | $57,975 |
Source: Public Records
Tax History Compared to Growth
Tax History
| Year | Tax Paid | Tax Assessment Tax Assessment Total Assessment is a certain percentage of the fair market value that is determined by local assessors to be the total taxable value of land and additions on the property. | Land | Improvement |
|---|---|---|---|---|
| 2024 | $1,344 | $14,145 | $1,800 | $12,345 |
| 2023 | $1,344 | $13,471 | $1,800 | $11,671 |
| 2022 | $1,295 | $12,830 | $1,800 | $11,030 |
| 2021 | $1,239 | $12,219 | $1,800 | $10,419 |
| 2020 | $1,258 | $12,332 | $1,800 | $10,532 |
| 2019 | $1,198 | $11,745 | $1,800 | $9,945 |
| 2018 | $1,166 | $11,185 | $1,800 | $9,385 |
| 2017 | $1,108 | $10,749 | $1,752 | $8,997 |
| 2016 | $1,057 | $10,737 | $1,800 | $8,937 |
| 2015 | $964 | $9,750 | $1,617 | $8,133 |
| 2014 | $964 | $9,285 | $1,440 | $7,845 |
Source: Public Records
Map
Nearby Homes
- 338 W Crooked Branch Way
- 534 W Pine Rose Court Way
- 557 W Pine Rose Court Way
- 413 W Pines Way
- 531 W Shadow Ridge Way
- 601 N Chisholm Trail Way
- 304 N Geronimo Way
- 0 N Mustang Rd
- 0 N Mustang Rd
- 608 N Remington Way
- 500 N Remington Way
- 3629 Blue Ave
- 3641 Pete St
- 3637 Blue Ave
- 912 N Barn Hill Way
- 14900 SW 74th St
- 14842 SW 74th St
- 350 W Elder Dr
- 805 W Old Farm Way
- 0 N Czech Hall Rd
- 441 W Branches Way
- 436 W Crooked Branch Way
- 442 W Crooked Branch Way
- 430 W Crooked Branch Way
- 423 W Branches Way
- 436 W Branches Way
- 424 W Crooked Branch Way
- 430 W Branches Way
- 442 W Branches Way
- 417 W Branches Way
- 701 N Willow Branch Way
- 705 N Willow Branch Way
- 424 W Branches Way
- 418 W Crooked Branch Way
- 709 N Willow Branch Way
- 609 N Willow Branch Way
- 418 W Branches Way
- 411 W Branches Way
- 441 W Apple Branch Way
- 435 W Apple Branch Way