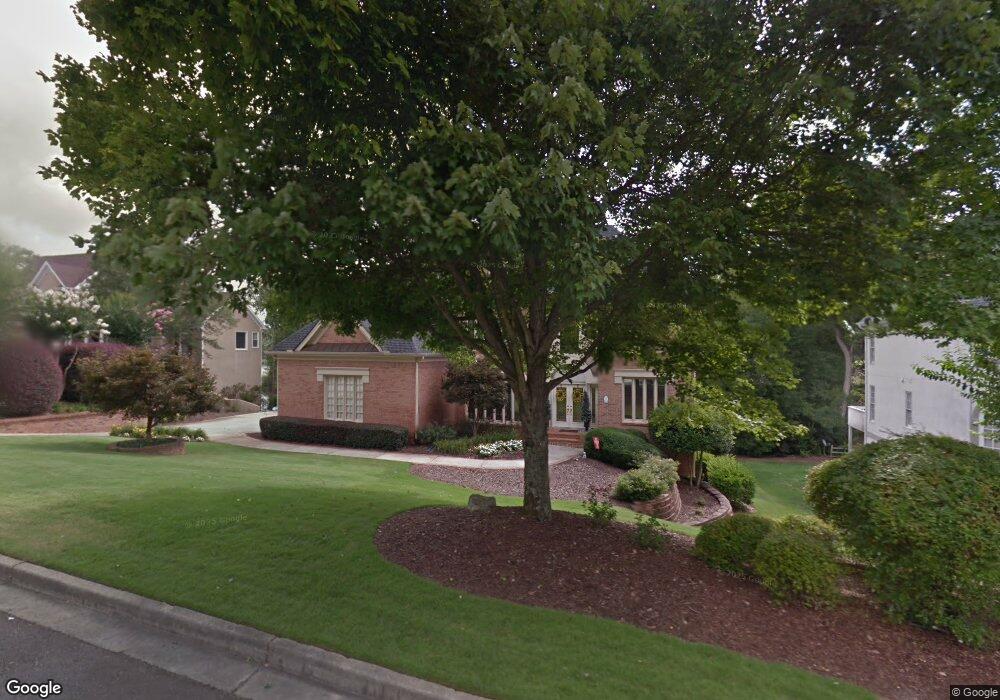
435 Water Shadow Ln Unit 4 Alpharetta, GA 30022
Nesbit Lakes NeighborhoodEstimated Value: $1,055,000 - $1,185,000
4
Beds
4
Baths
4,208
Sq Ft
$267/Sq Ft
Est. Value
About This Home
This home is located at 435 Water Shadow Ln Unit 4, Alpharetta, GA 30022 and is currently estimated at $1,122,742, approximately $266 per square foot. 435 Water Shadow Ln Unit 4 is a home located in Fulton County with nearby schools including Hillside Elementary School, Haynes Bridge Middle School, and Centennial High School.
Ownership History
Date
Name
Owned For
Owner Type
Purchase Details
Closed on
Jan 5, 2000
Sold by
Smith Paul L and Smith Claire D
Bought by
Houghton Timothy C and Houghton Donna L
Current Estimated Value
Home Financials for this Owner
Home Financials are based on the most recent Mortgage that was taken out on this home.
Original Mortgage
$245,000
Interest Rate
7.38%
Mortgage Type
New Conventional
Purchase Details
Closed on
Aug 6, 1993
Sold by
Martin Linda Homes Inc
Bought by
Smith Paul L Claire D
Home Financials for this Owner
Home Financials are based on the most recent Mortgage that was taken out on this home.
Original Mortgage
$340,900
Interest Rate
7.26%
Create a Home Valuation Report for This Property
The Home Valuation Report is an in-depth analysis detailing your home's value as well as a comparison with similar homes in the area
Home Values in the Area
Average Home Value in this Area
Purchase History
| Date | Buyer | Sale Price | Title Company |
|---|---|---|---|
| Houghton Timothy C | $509,300 | -- | |
| Smith Paul L Claire D | $426,300 | -- |
Source: Public Records
Mortgage History
| Date | Status | Borrower | Loan Amount |
|---|---|---|---|
| Previous Owner | Houghton Timothy C | $245,000 | |
| Previous Owner | Smith Paul L Claire D | $340,900 |
Source: Public Records
Tax History Compared to Growth
Tax History
| Year | Tax Paid | Tax Assessment Tax Assessment Total Assessment is a certain percentage of the fair market value that is determined by local assessors to be the total taxable value of land and additions on the property. | Land | Improvement |
|---|---|---|---|---|
| 2025 | $1,550 | $329,280 | $78,440 | $250,840 |
| 2023 | $8,906 | $315,520 | $56,360 | $259,160 |
| 2022 | $7,081 | $310,160 | $45,320 | $264,840 |
| 2021 | $1,198 | $254,000 | $47,120 | $206,880 |
| 2020 | $7,971 | $254,000 | $47,120 | $206,880 |
| 2019 | $1,180 | $280,280 | $47,120 | $233,160 |
| 2018 | $7,060 | $273,720 | $46,000 | $227,720 |
| 2017 | $7,027 | $261,560 | $44,240 | $217,320 |
| 2016 | $6,994 | $261,560 | $44,240 | $217,320 |
| 2015 | $8,446 | $261,560 | $44,240 | $217,320 |
| 2014 | $6,094 | $211,560 | $25,880 | $185,680 |
Source: Public Records
Map
Nearby Homes
- 9195 Nesbit Lakes Dr
- 940 Waters Reach Ct
- 920 Waters Reach Ct
- 109 W Ridge Way
- 4040 Declaration Dr
- 245 Spring Ridge Trace
- 590 Ridgemont Dr
- 205 Nesbit Entry Dr
- 1250 Atherton Park
- 1020 Summer Oaks Close Unit 4
- 1035 Penny Ln
- 2765 Chandon Place
- 530 Silver Pine Trail
- 420 Little Pines Ct
- 1050 Terramont Dr
- 1220 Terramont Dr
- 9985 Lake Forest Way
- 585 Saint Regis Ln
- 2060 Six Branches Dr
- 445 Water Shadow Ln
- 425 Water Shadow Ln
- 9215 Nesbit Lakes Dr Unit 5
- 9205 Nesbit Lakes Dr
- 440 Water Shadow Ln Unit 4
- 455 Water Shadow Ln Unit 4
- 9225 Nesbit Lakes Dr Unit 5
- 450 Water Shadow Ln
- 415 Water Shadow Ln
- 430 Water Shadow Ln Unit 4
- 460 Water Shadow Ln Unit 4
- 465 Water Shadow Ln
- 0 Water Shadow Ln Unit 3280381
- 0 Water Shadow Ln Unit 8617851
- 0 Water Shadow Ln Unit 8056035
- 0 Water Shadow Ln Unit 8414960
- 0 Water Shadow Ln Unit 3193679
- 9235 Nesbit Lakes Dr
- 420 Water Shadow Ln
- 9200 Nesbit Lakes Dr