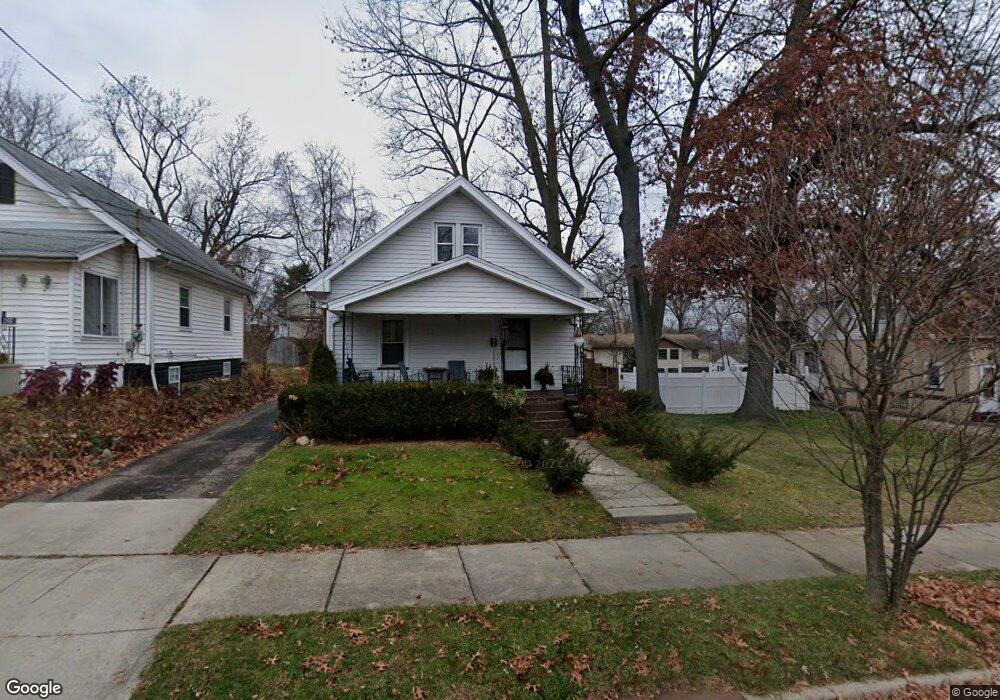
435 Westmoreland St Akron, OH 44314
Kenmore NeighborhoodEstimated Value: $92,000 - $116,624
2
Beds
2
Baths
972
Sq Ft
$110/Sq Ft
Est. Value
About This Home
This home is located at 435 Westmoreland St, Akron, OH 44314 and is currently estimated at $107,406, approximately $110 per square foot. 435 Westmoreland St is a home located in Summit County with nearby schools including Sam Salem Community Learning Center.
Ownership History
Date
Name
Owned For
Owner Type
Purchase Details
Closed on
Mar 23, 2011
Sold by
Jones Chelsea N and Jones James E
Bought by
Pennington Clyde D
Current Estimated Value
Purchase Details
Closed on
Feb 22, 2005
Sold by
King David M and King Angela M
Bought by
Jones Chelsea N and Jones James E
Home Financials for this Owner
Home Financials are based on the most recent Mortgage that was taken out on this home.
Original Mortgage
$77,779
Interest Rate
5.8%
Mortgage Type
FHA
Purchase Details
Closed on
Mar 13, 2003
Sold by
Wages Willis H
Bought by
King David M
Home Financials for this Owner
Home Financials are based on the most recent Mortgage that was taken out on this home.
Original Mortgage
$65,075
Interest Rate
6%
Mortgage Type
New Conventional
Purchase Details
Closed on
May 30, 2000
Sold by
Cherry Audrey Jane
Bought by
Cherry Audrey Jane and Wages Willis H
Create a Home Valuation Report for This Property
The Home Valuation Report is an in-depth analysis detailing your home's value as well as a comparison with similar homes in the area
Home Values in the Area
Average Home Value in this Area
Purchase History
| Date | Buyer | Sale Price | Title Company |
|---|---|---|---|
| Pennington Clyde D | $23,500 | Barristers Of Ohio | |
| Jones Chelsea N | $79,000 | Title First Agency Inc | |
| King David M | $68,500 | -- | |
| Cherry Audrey Jane | -- | -- |
Source: Public Records
Mortgage History
| Date | Status | Borrower | Loan Amount |
|---|---|---|---|
| Previous Owner | Jones Chelsea N | $77,779 | |
| Previous Owner | King David M | $65,075 |
Source: Public Records
Tax History Compared to Growth
Tax History
| Year | Tax Paid | Tax Assessment Tax Assessment Total Assessment is a certain percentage of the fair market value that is determined by local assessors to be the total taxable value of land and additions on the property. | Land | Improvement |
|---|---|---|---|---|
| 2025 | $1,720 | $31,749 | $7,858 | $23,891 |
| 2024 | $1,720 | $31,749 | $7,858 | $23,891 |
| 2023 | $1,720 | $31,749 | $7,858 | $23,891 |
| 2022 | $1,373 | $19,667 | $4,792 | $14,875 |
| 2021 | $1,374 | $19,667 | $4,792 | $14,875 |
| 2020 | $1,354 | $19,670 | $4,790 | $14,880 |
| 2019 | $1,466 | $19,440 | $4,460 | $14,980 |
| 2018 | $1,447 | $19,440 | $4,460 | $14,980 |
| 2017 | $1,575 | $19,440 | $4,460 | $14,980 |
| 2016 | $1,576 | $20,910 | $4,790 | $16,120 |
| 2015 | $1,575 | $20,910 | $4,790 | $16,120 |
| 2014 | $1,562 | $20,910 | $4,790 | $16,120 |
| 2013 | $1,756 | $24,140 | $4,790 | $19,350 |
Source: Public Records
Map
Nearby Homes
- 451 Allenford St
- 2365 Pelton Ave
- 363 Lockwood St
- 355 Lockwood St
- 590 Flora Ave
- 364 Rexford St
- 636 Flora Ave
- 2513 Christensen Ave
- 2531 Pelton Ave
- 2303 6th St SW
- 2199 6th St SW
- 2238 7th St SW
- 2186 5th St SW
- 2323 11th St SW
- 2332 11th St SW
- 2291 11th St SW
- 75 W Dartmore Ave
- 2278 11th St SW
- 592 Sharon St
- 2134 7th St SW
- 439 Westmoreland St
- 429 Westmoreland St
- 443 Westmoreland St
- 444 Allenford St
- 425 Westmoreland St
- 448 Allenford St
- 440 Allenford St
- 452 Allenford St
- 430 Westmoreland St
- 436 Westmoreland St
- 453 Westmoreland St
- 419 Westmoreland St
- 454 Allenford St
- 442 Westmoreland St
- 456 Allenford St
- 434 Allenford St
- 462 Allenford St
- 428 Allenford St
- 450 Westmoreland St
- 424 Westmoreland St