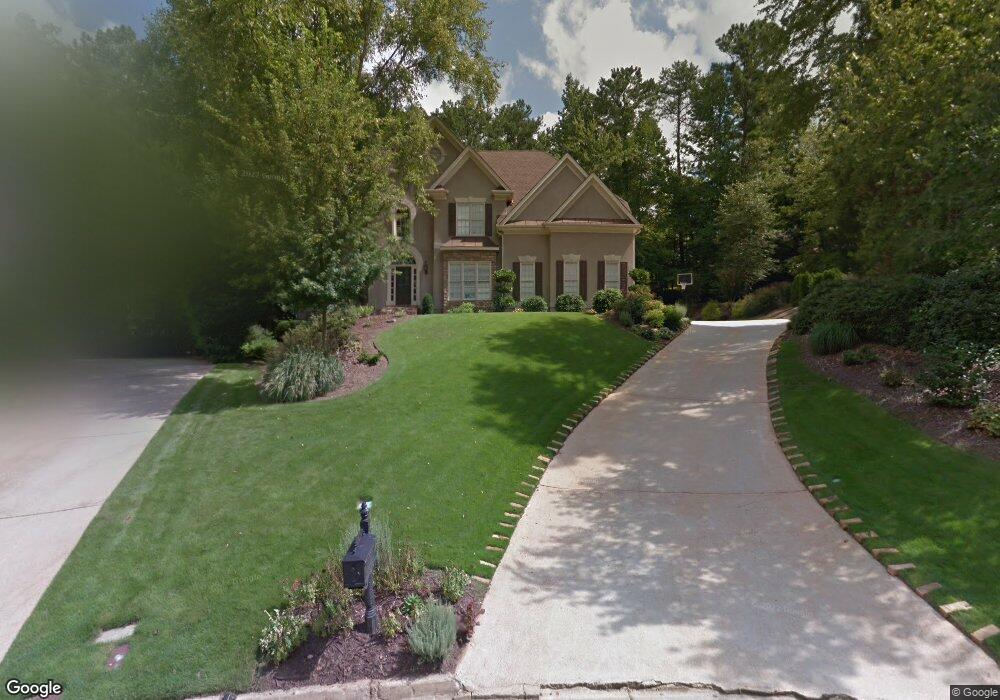
435 Whispering Wind Ln Unit 1 Alpharetta, GA 30022
Nesbit Lakes NeighborhoodEstimated Value: $923,562 - $1,095,000
4
Beds
4
Baths
3,851
Sq Ft
$262/Sq Ft
Est. Value
About This Home
This home is located at 435 Whispering Wind Ln Unit 1, Alpharetta, GA 30022 and is currently estimated at $1,008,891, approximately $261 per square foot. 435 Whispering Wind Ln Unit 1 is a home located in Fulton County with nearby schools including Hillside Elementary School, Haynes Bridge Middle School, and Centennial High School.
Ownership History
Date
Name
Owned For
Owner Type
Purchase Details
Closed on
Mar 8, 2004
Sold by
Horras Daniel A
Bought by
Horras Daniel A and Horras Linda
Current Estimated Value
Home Financials for this Owner
Home Financials are based on the most recent Mortgage that was taken out on this home.
Original Mortgage
$333,700
Outstanding Balance
$156,503
Interest Rate
5.72%
Mortgage Type
New Conventional
Estimated Equity
$852,388
Purchase Details
Closed on
Feb 27, 2003
Sold by
Braley Frederick W and Braley Jane
Bought by
Horras Daniel A and Horras Linda B
Home Financials for this Owner
Home Financials are based on the most recent Mortgage that was taken out on this home.
Original Mortgage
$250,000
Interest Rate
5.95%
Mortgage Type
New Conventional
Purchase Details
Closed on
Apr 5, 1995
Sold by
Strausser Christopher Lisa
Bought by
Braley Frederick W Jane L
Create a Home Valuation Report for This Property
The Home Valuation Report is an in-depth analysis detailing your home's value as well as a comparison with similar homes in the area
Home Values in the Area
Average Home Value in this Area
Purchase History
| Date | Buyer | Sale Price | Title Company |
|---|---|---|---|
| Horras Daniel A | $1,000 | -- | |
| Horras Daniel A | $1,000 | -- | |
| Horras Daniel A | $400,000 | -- | |
| Braley Frederick W Jane L | $350,000 | -- |
Source: Public Records
Mortgage History
| Date | Status | Borrower | Loan Amount |
|---|---|---|---|
| Open | Horras Daniel A | $333,700 | |
| Previous Owner | Horras Daniel A | $250,000 | |
| Closed | Braley Frederick W Jane L | $0 |
Source: Public Records
Tax History Compared to Growth
Tax History
| Year | Tax Paid | Tax Assessment Tax Assessment Total Assessment is a certain percentage of the fair market value that is determined by local assessors to be the total taxable value of land and additions on the property. | Land | Improvement |
|---|---|---|---|---|
| 2025 | $1,197 | $277,800 | $88,160 | $189,640 |
| 2023 | $7,428 | $263,160 | $63,360 | $199,800 |
| 2022 | $5,454 | $255,160 | $50,960 | $204,200 |
| 2021 | $6,445 | $236,840 | $40,920 | $195,920 |
| 2020 | $6,540 | $225,560 | $49,040 | $176,520 |
| 2019 | $1,019 | $209,880 | $52,920 | $156,960 |
| 2018 | $5,414 | $204,960 | $51,680 | $153,280 |
| 2017 | $5,403 | $197,120 | $49,720 | $147,400 |
| 2016 | $5,384 | $197,120 | $49,720 | $147,400 |
| 2015 | $6,479 | $197,120 | $49,720 | $147,400 |
| 2014 | $4,362 | $155,040 | $29,080 | $125,960 |
Source: Public Records
Map
Nearby Homes
- 940 Waters Reach Ct
- 205 Nesbit Entry Dr
- 2765 Chandon Place
- 160 Arden Place
- 9195 Nesbit Lakes Dr
- 1020 Summer Oaks Close Unit 4
- 280 Vidaulan Ct
- 245 Spring Ridge Trace
- 1094 Township Square
- 4040 Declaration Dr
- 9110 Twelvestones Dr
- 109 W Ridge Way
- 148 W Ridge Way
- 2642 Long Pointe
- 3010 Kara Ct
- 3020 Kara Ct
- 445 Whispering Wind Ln
- 425 Whispering Wind Ln
- 9515 Nesbit Lakes Dr
- 9525 Nesbit Lakes Dr
- 9505 Nesbit Lakes Dr
- 9535 Nesbit Lakes Dr Unit 1
- 0 Whispering Wind Ln Unit 7464744
- 0 Whispering Wind Ln Unit 8511601
- 0 Whispering Wind Ln Unit 7015415
- 0 Whispering Wind Ln
- 9495 Nesbit Lakes Dr
- 415 Whispering Wind Ln
- 470 Whispering Wind Ln Unit 1
- 9485 Nesbit Lakes Dr
- 460 Whispering Wind Ln
- 9475 Nesbit Lakes Dr
- 450 Whispering Wind Ln
- 9545 Nesbit Lakes Dr Unit 1
- 440 Whispering Wind Ln
- 9465 Nesbit Lakes Dr