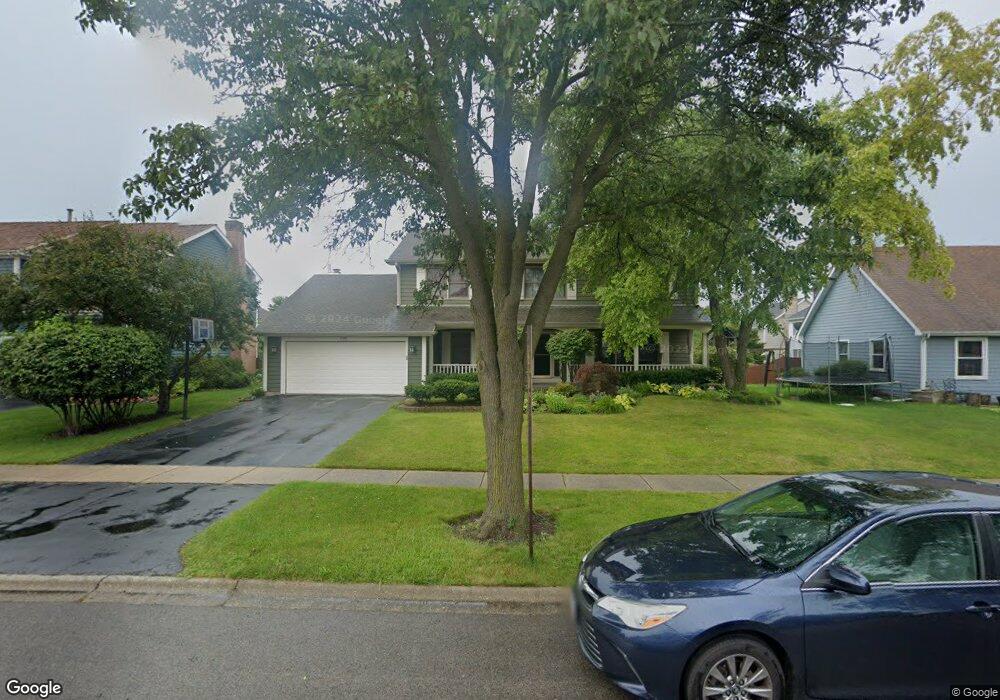
435 Wicks St Grayslake, IL 60030
Estimated Value: $454,286 - $528,000
4
Beds
3
Baths
2,366
Sq Ft
$203/Sq Ft
Est. Value
About This Home
This home is located at 435 Wicks St, Grayslake, IL 60030 and is currently estimated at $481,322, approximately $203 per square foot. 435 Wicks St is a home located in Lake County with nearby schools including Frederick School, Prairieview School, and Grayslake Middle School.
Ownership History
Date
Name
Owned For
Owner Type
Purchase Details
Closed on
Apr 4, 2011
Sold by
Kivlehan Todd and Kivlehan Georgene H
Bought by
Helvie Dustin and Helvie Sarah
Current Estimated Value
Home Financials for this Owner
Home Financials are based on the most recent Mortgage that was taken out on this home.
Original Mortgage
$282,648
Outstanding Balance
$201,254
Interest Rate
5.5%
Mortgage Type
FHA
Estimated Equity
$280,068
Purchase Details
Closed on
Apr 8, 1999
Sold by
Mccomas Steven G and Mccomas Clara D
Bought by
Kivlehan Todd and Kivlehan Georgene H
Home Financials for this Owner
Home Financials are based on the most recent Mortgage that was taken out on this home.
Original Mortgage
$200,000
Interest Rate
7.04%
Purchase Details
Closed on
May 28, 1997
Sold by
Abramo Donald J and Abramo Nancy C
Bought by
Mccomas Steven G and Mccomas Clara D
Home Financials for this Owner
Home Financials are based on the most recent Mortgage that was taken out on this home.
Original Mortgage
$214,600
Interest Rate
7.5%
Create a Home Valuation Report for This Property
The Home Valuation Report is an in-depth analysis detailing your home's value as well as a comparison with similar homes in the area
Home Values in the Area
Average Home Value in this Area
Purchase History
| Date | Buyer | Sale Price | Title Company |
|---|---|---|---|
| Helvie Dustin | $290,000 | Commonwealth Land Title Insu | |
| Kivlehan Todd | $250,000 | -- | |
| Mccomas Steven G | $245,500 | First American Title |
Source: Public Records
Mortgage History
| Date | Status | Borrower | Loan Amount |
|---|---|---|---|
| Open | Helvie Dustin | $282,648 | |
| Previous Owner | Kivlehan Todd | $200,000 | |
| Previous Owner | Mccomas Steven G | $214,600 |
Source: Public Records
Tax History Compared to Growth
Tax History
| Year | Tax Paid | Tax Assessment Tax Assessment Total Assessment is a certain percentage of the fair market value that is determined by local assessors to be the total taxable value of land and additions on the property. | Land | Improvement |
|---|---|---|---|---|
| 2024 | $12,292 | $122,607 | $19,133 | $103,474 |
| 2023 | $11,478 | $112,525 | $17,560 | $94,965 |
| 2022 | $11,478 | $101,719 | $14,350 | $87,369 |
| 2021 | $11,347 | $97,769 | $13,793 | $83,976 |
| 2020 | $11,348 | $93,025 | $13,124 | $79,901 |
| 2019 | $10,957 | $89,249 | $12,591 | $76,658 |
| 2018 | $10,910 | $89,457 | $15,219 | $74,238 |
| 2017 | $10,853 | $84,148 | $14,316 | $69,832 |
| 2016 | $10,418 | $77,677 | $13,215 | $64,462 |
| 2015 | $10,155 | $70,964 | $12,073 | $58,891 |
| 2014 | $9,517 | $66,604 | $11,756 | $54,848 |
| 2012 | $9,365 | $69,560 | $12,278 | $57,282 |
Source: Public Records
Map
Nearby Homes
- 390 N Garfield Blvd
- 10 Glen St
- 349 Brittain Ave
- 42 Village Station Ln
- 102 Soo Line Dr
- 533 Cannon Ball Dr
- 146 Westerfield Place
- 231 Lionel Dr
- 121 Park Ave
- 270 Lionel Dr
- 228 Station Park Cir
- 11 S Lake St
- 220 Bluff Ct
- 101 Burton St
- Lot 48 Lake Ave
- 32100 Alleghany Rd
- 34110 S Circle Dr
- 26155 W Il Route 120
- 1617 Albany St
- 566 Chard Ct
- 449 Wicks St
- 419 Wicks St
- 421 Sommerset Dr
- 430 Iron Horse Ct
- 438 Iron Horse Ct
- 463 Wicks St
- 433 Sommerset Dr
- 446 Iron Horse Ct
- 426 Wicks St
- 440 Wicks St
- 414 Wicks St
- 458 Wicks St
- 473 Wicks St
- 454 Iron Horse Ct
- 466 Wicks St
- 393 Sommerset Dr
- 470 Iron Horse Ct
- 481 Wicks St
- 410 Sommerset Dr
- 418 Sommerset Dr