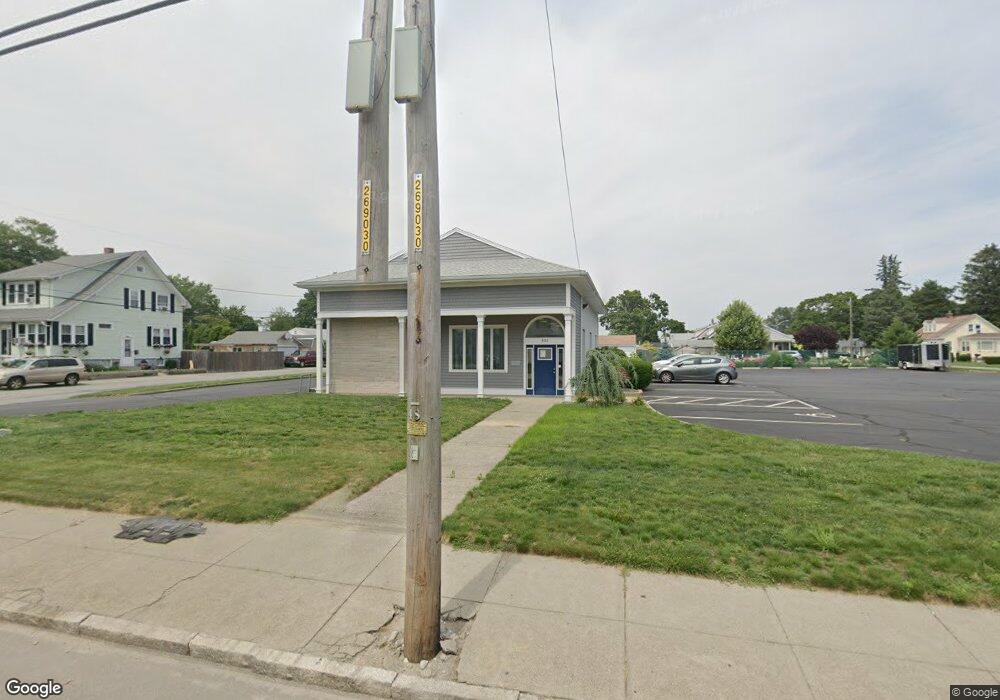
435 Wilbur Ave Swansea, MA 02777
Ocean Grove NeighborhoodEstimated Value: $539,120
--
Bed
--
Bath
2,121
Sq Ft
$254/Sq Ft
Est. Value
About This Home
This home is located at 435 Wilbur Ave, Swansea, MA 02777 and is currently estimated at $539,120, approximately $254 per square foot. 435 Wilbur Ave is a home located in Bristol County with nearby schools including Joseph Case High School and Swansea Wood School.
Ownership History
Date
Name
Owned For
Owner Type
Purchase Details
Closed on
Nov 17, 2006
Sold by
Poisson Assoc Inc
Bought by
1851 Corp
Current Estimated Value
Purchase Details
Closed on
Dec 16, 1996
Sold by
Fleet Natl Bk
Bought by
Poisson Assoc Inc
Home Financials for this Owner
Home Financials are based on the most recent Mortgage that was taken out on this home.
Original Mortgage
$65,000
Interest Rate
7.75%
Mortgage Type
Commercial
Purchase Details
Closed on
Mar 21, 1988
Sold by
1St Natl Bk Boston
Bought by
New Bedford Inst Sav
Create a Home Valuation Report for This Property
The Home Valuation Report is an in-depth analysis detailing your home's value as well as a comparison with similar homes in the area
Home Values in the Area
Average Home Value in this Area
Purchase History
| Date | Buyer | Sale Price | Title Company |
|---|---|---|---|
| 1851 Corp | $550,000 | -- | |
| Poisson Assoc Inc | $90,000 | -- | |
| New Bedford Inst Sav | $331,000 | -- |
Source: Public Records
Mortgage History
| Date | Status | Borrower | Loan Amount |
|---|---|---|---|
| Previous Owner | New Bedford Inst Sav | $65,000 |
Source: Public Records
Tax History Compared to Growth
Tax History
| Year | Tax Paid | Tax Assessment Tax Assessment Total Assessment is a certain percentage of the fair market value that is determined by local assessors to be the total taxable value of land and additions on the property. | Land | Improvement |
|---|---|---|---|---|
| 2025 | $7,709 | $421,000 | $172,000 | $249,000 |
| 2024 | $7,738 | $421,000 | $172,000 | $249,000 |
| 2023 | $8,355 | $413,200 | $172,300 | $240,900 |
| 2022 | $9,318 | $413,200 | $172,300 | $240,900 |
| 2021 | $8,600 | $350,300 | $180,200 | $170,100 |
| 2020 | $8,649 | $350,300 | $180,200 | $170,100 |
| 2019 | $8,565 | $341,100 | $163,200 | $177,900 |
| 2018 | $8,589 | $341,100 | $163,200 | $177,900 |
| 2017 | $7,938 | $347,400 | $163,200 | $184,200 |
| 2016 | $8,053 | $343,700 | $163,200 | $180,500 |
| 2015 | $8,187 | $343,700 | $163,200 | $180,500 |
| 2014 | $8,056 | $343,700 | $163,200 | $180,500 |
Source: Public Records
Map
Nearby Homes
- 41 James Ave
- 20 Sherbourne Ave
- 196 Coolidge St
- 153 Puffer Ave
- 105 Birchwood Dr
- 25 Inverness Rd
- 502 Ocean Grove Ave
- 19 Richard Rd
- 34 Columbia Rd
- 19 Keller Ave
- 159 Wilder St
- 79 Cedar Ave
- 123 Calef Ave
- 110 Seaview Ave
- 30 Front St
- 24 Front St
- 127 Sheraton Ave
- 675 Lees River Ave
- 0 Hortonville Rd Unit 73242268
- 95 Winslow Way