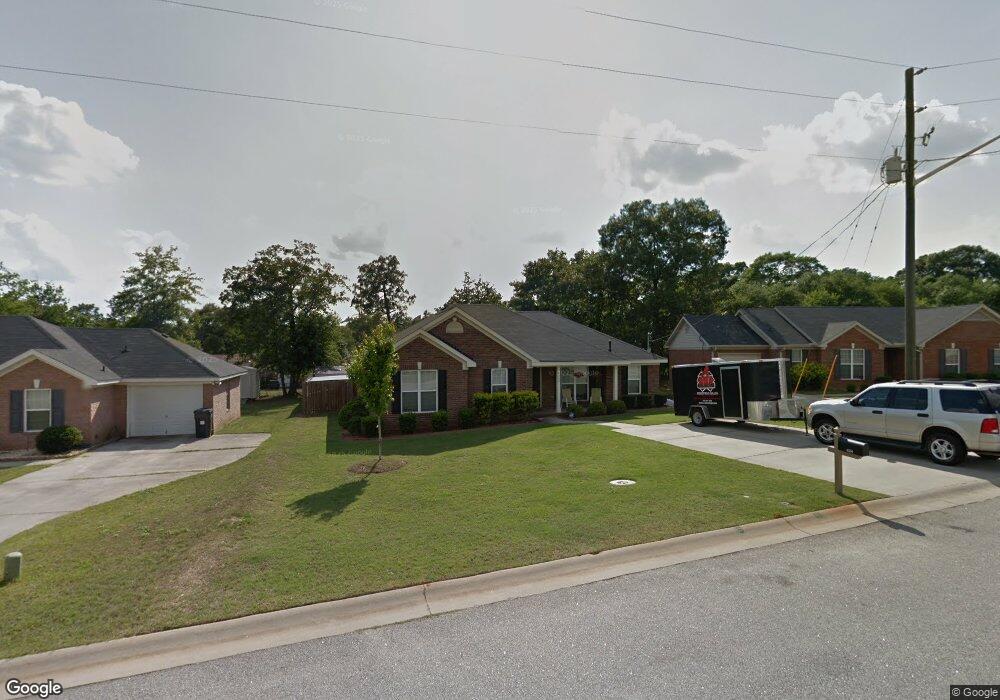
4350 Sanderling Dr Augusta, GA 30906
Richmond Factory NeighborhoodEstimated Value: $204,000 - $257,000
3
Beds
2
Baths
1,709
Sq Ft
$132/Sq Ft
Est. Value
About This Home
This home is located at 4350 Sanderling Dr, Augusta, GA 30906 and is currently estimated at $226,274, approximately $132 per square foot. 4350 Sanderling Dr is a home located in Richmond County with nearby schools including R.B. Hunt Elementary School, Diamond Lakes Elementary School, and Pine Hill Middle School.
Ownership History
Date
Name
Owned For
Owner Type
Purchase Details
Closed on
Oct 6, 2021
Sold by
Williamson Daniel Blake
Bought by
Williamson Daniel Blake and Williamson Jacqueline H
Current Estimated Value
Home Financials for this Owner
Home Financials are based on the most recent Mortgage that was taken out on this home.
Original Mortgage
$145,500
Outstanding Balance
$132,394
Interest Rate
2.8%
Mortgage Type
VA
Estimated Equity
$93,880
Purchase Details
Closed on
Feb 23, 2009
Sold by
Jones Wanda Lynn
Bought by
Williamson Daniel Blake
Home Financials for this Owner
Home Financials are based on the most recent Mortgage that was taken out on this home.
Original Mortgage
$118,830
Interest Rate
5.03%
Mortgage Type
VA
Purchase Details
Closed on
Sep 29, 2005
Sold by
Nordahl Homes Inc
Bought by
Jones Wanda Lynn
Home Financials for this Owner
Home Financials are based on the most recent Mortgage that was taken out on this home.
Original Mortgage
$131,087
Interest Rate
5.72%
Mortgage Type
VA
Create a Home Valuation Report for This Property
The Home Valuation Report is an in-depth analysis detailing your home's value as well as a comparison with similar homes in the area
Home Values in the Area
Average Home Value in this Area
Purchase History
| Date | Buyer | Sale Price | Title Company |
|---|---|---|---|
| Williamson Daniel Blake | -- | -- | |
| Williamson Daniel Blake | $116,400 | None Available | |
| Jones Wanda Lynn | $126,900 | -- |
Source: Public Records
Mortgage History
| Date | Status | Borrower | Loan Amount |
|---|---|---|---|
| Open | Williamson Daniel Blake | $145,500 | |
| Previous Owner | Williamson Daniel Blake | $118,830 | |
| Previous Owner | Jones Wanda Lynn | $131,087 |
Source: Public Records
Tax History Compared to Growth
Tax History
| Year | Tax Paid | Tax Assessment Tax Assessment Total Assessment is a certain percentage of the fair market value that is determined by local assessors to be the total taxable value of land and additions on the property. | Land | Improvement |
|---|---|---|---|---|
| 2025 | $470 | $90,056 | $6,360 | $83,696 |
| 2024 | $470 | $88,332 | $6,360 | $81,972 |
| 2023 | $2,414 | $79,924 | $6,360 | $73,564 |
| 2022 | $2,323 | $68,820 | $6,360 | $62,460 |
| 2021 | $1,902 | $49,004 | $6,360 | $42,644 |
| 2020 | $1,873 | $49,004 | $6,360 | $42,644 |
| 2019 | $1,981 | $49,004 | $6,360 | $42,644 |
| 2018 | $1,997 | $49,098 | $6,360 | $42,738 |
| 2017 | $1,948 | $49,098 | $6,360 | $42,738 |
| 2016 | $1,950 | $49,098 | $6,360 | $42,738 |
| 2015 | $1,963 | $49,098 | $6,360 | $42,738 |
| 2014 | $1,927 | $47,932 | $6,360 | $41,572 |
Source: Public Records
Map
Nearby Homes
- 2264 Basswood Dr
- 2383 Richwood Dr
- 4310 Sanderling Dr
- 2348 Fieldcrest Rd
- 2114 Boykin Rd
- 2106 Boykin Rd
- 2219 Travis Rd
- 2325 Moncrieff St
- 2104 Travis Rd
- 2110 Travis Rd
- 2339 Basswood Dr
- 2264 Nellie Dr
- 2325 Travis Rd
- 2382 Travis Pines Dr
- 2382 Patrick Ave
- 2316 Oketo Dr
- Porter II Plan at Wedgewood
- Julie II Plan at Wedgewood
- Devonshire ll Plan at Wedgewood
- Benton II Plan at Wedgewood
- 4348 Sanderling Dr
- 4352 Sanderling Dr
- 2312 Fieldcrest Rd
- 2314 Fieldcrest Rd
- 4354 Sanderling Dr
- 4346 Sanderling Dr
- 2310 Fieldcrest Rd
- 4349 Sanderling Dr
- 4345 Sanderling Dr
- 2316 Fieldcrest Rd
- 4355 Sanderling Dr
- 4353 Sanderling Dr
- 4344 Sanderling Dr
- 4341 Sanderling Dr
- 2308 Fieldcrest Rd
- 2318 Fieldcrest Rd
- 4342 Sanderling Dr
- 4703 Grebe Ct
- 2309 Fieldcrest Rd
- 2307 Fieldcrest Rd