Estimated Value: $225,000 - $247,000
2
Beds
2
Baths
1,430
Sq Ft
$164/Sq Ft
Est. Value
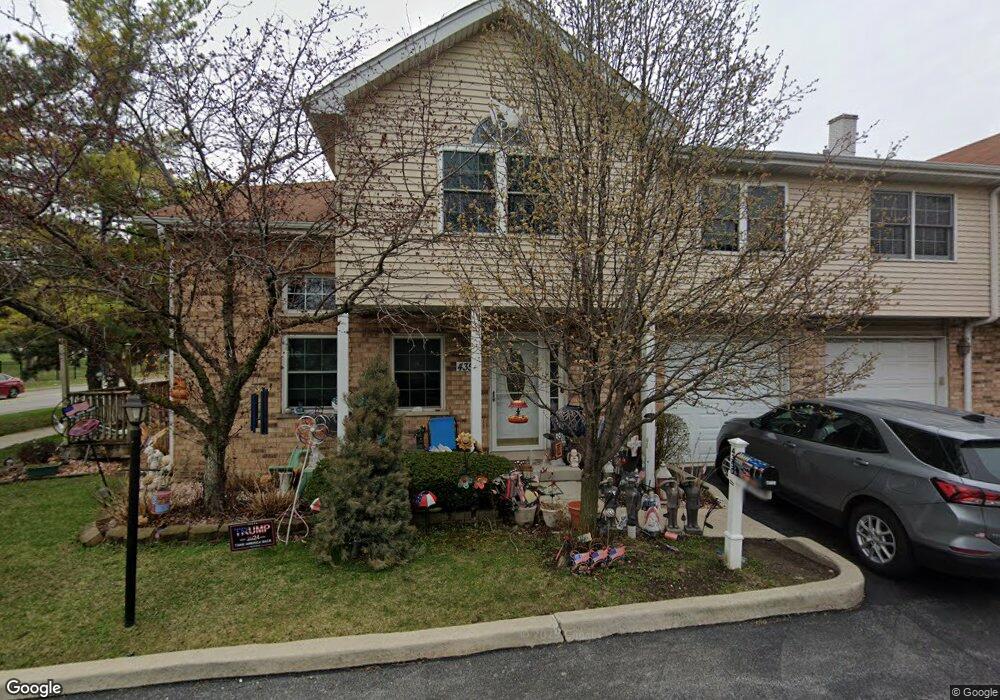
About This Home
This home is located at 4350 W Emerald Way St, Alsip, IL 60803 and is currently estimated at $234,297, approximately $163 per square foot. 4350 W Emerald Way St is a home located in Cook County with nearby schools including Lane Elementary School, Prairie Jr High School, and A B Shepard High School.
Ownership History
Date
Name
Owned For
Owner Type
Purchase Details
Closed on
Nov 10, 2005
Sold by
Rinsema Nathan and Rinsema Nicole
Bought by
Basile Kathleen A
Current Estimated Value
Purchase Details
Closed on
Dec 20, 2000
Sold by
Orourke Fidelma J and Haran Fidelma J
Bought by
Rinsema Nathan and Rinsema Nicole
Home Financials for this Owner
Home Financials are based on the most recent Mortgage that was taken out on this home.
Original Mortgage
$118,750
Interest Rate
7.8%
Purchase Details
Closed on
Aug 22, 1995
Sold by
State Bank Of Countryside
Bought by
Haran Fidelma J
Home Financials for this Owner
Home Financials are based on the most recent Mortgage that was taken out on this home.
Original Mortgage
$108,900
Interest Rate
7.76%
Create a Home Valuation Report for This Property
The Home Valuation Report is an in-depth analysis detailing your home's value as well as a comparison with similar homes in the area
Home Values in the Area
Average Home Value in this Area
Purchase History
| Date | Buyer | Sale Price | Title Company |
|---|---|---|---|
| Basile Kathleen A | $175,000 | Cti | |
| Rinsema Nathan | $125,000 | Stewart Title | |
| Haran Fidelma J | $121,000 | -- |
Source: Public Records
Mortgage History
| Date | Status | Borrower | Loan Amount |
|---|---|---|---|
| Previous Owner | Rinsema Nathan | $118,750 | |
| Previous Owner | Haran Fidelma J | $108,900 |
Source: Public Records
Tax History Compared to Growth
Tax History
| Year | Tax Paid | Tax Assessment Tax Assessment Total Assessment is a certain percentage of the fair market value that is determined by local assessors to be the total taxable value of land and additions on the property. | Land | Improvement |
|---|---|---|---|---|
| 2024 | $4,318 | $19,000 | $695 | $18,305 |
| 2023 | $3,180 | $19,000 | $695 | $18,305 |
| 2022 | $3,180 | $15,431 | $600 | $14,831 |
| 2021 | $2,945 | $15,429 | $599 | $14,830 |
| 2020 | $2,712 | $15,429 | $599 | $14,830 |
| 2019 | $3,110 | $17,211 | $536 | $16,675 |
| 2018 | $2,999 | $17,211 | $536 | $16,675 |
| 2017 | $2,968 | $17,211 | $536 | $16,675 |
| 2016 | $4,031 | $15,842 | $442 | $15,400 |
| 2015 | $4,201 | $15,842 | $442 | $15,400 |
| 2014 | $3,971 | $15,842 | $442 | $15,400 |
| 2013 | $3,760 | $15,457 | $442 | $15,015 |
Source: Public Records
Map
Nearby Homes
- 4343 W Emerald Way St
- 4336 W Emerald Way St
- 4326 W Emerald Way St
- 4406 W 127th Place
- 12736 S Kenneth Ave Unit 1A
- 12738 S Kenneth Ave Unit E
- 12507 S Tripp Ave
- 12824 S Kenneth Ave Unit F1
- 4654 W 131st St Unit 1S
- 3909 W 123rd St Unit 205A
- 12026 S Kildare Ave Unit 16
- 4735 W 122nd St
- 3823 W 123rd St Unit 302
- 3821 W 123rd St Unit 301
- 3729 W Glen Dr Unit 804
- 12147 S Cicero Ave
- 12211 S Harding Ave
- 4818 W 122nd St Unit 3W
- 12539 S Quinn Dr Unit 402
- 14350 S Pulaski Rd
- 4349 W Emerald Way St
- 4344 W Emerald Way St
- 4348 W Emerald Way St
- 4338 W Emerald Way St
- 4337 W Emerald Way St
- 4342 W Emerald Way St
- 12639 S Kostner Ave Unit 3C
- 12639 S Kostner Ave Unit 1C
- 12639 S Kostner Ave Unit 1D
- 12639 S Kostner Ave Unit 2D
- 12639 S Kostner Ave Unit 3D
- 12639 S Kostner Ave Unit 2C
- 12643 S Kostner Ave Unit 1B
- 12643 S Kostner Ave Unit 3A
- 12643 S Kostner Ave Unit 3B
- 12643 S Kostner Ave Unit 2A
- 12643 S Kostner Ave Unit 1A
- 12643 S Kostner Ave Unit 2B
- 12635 S Kostner Ave Unit 2F
- 12635 S Kostner Ave Unit 2E