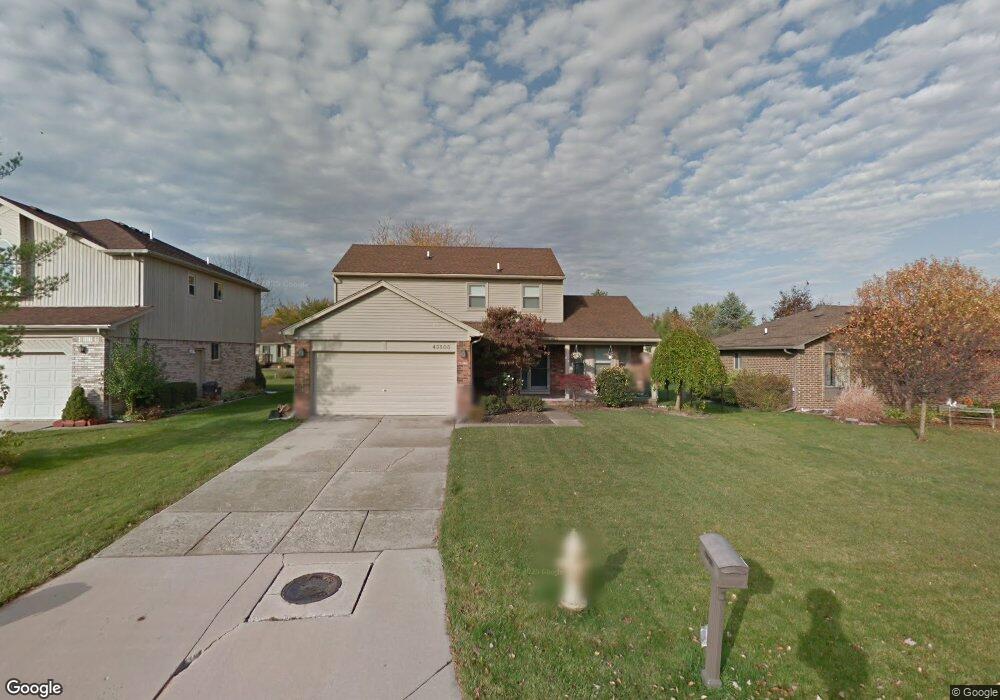
43503 Devin Dr Clinton Township, MI 48038
Estimated Value: $365,000 - $404,000
3
Beds
2
Baths
1,835
Sq Ft
$208/Sq Ft
Est. Value
About This Home
This home is located at 43503 Devin Dr, Clinton Township, MI 48038 and is currently estimated at $381,561, approximately $207 per square foot. 43503 Devin Dr is a home located in Macomb County with nearby schools including Erie Elementary School, Wyandot Middle School, and Chippewa Valley High School.
Ownership History
Date
Name
Owned For
Owner Type
Purchase Details
Closed on
Dec 7, 2018
Sold by
Brooks Carol M
Bought by
Trice Susan J
Current Estimated Value
Home Financials for this Owner
Home Financials are based on the most recent Mortgage that was taken out on this home.
Original Mortgage
$110,000
Outstanding Balance
$96,912
Interest Rate
4.8%
Mortgage Type
New Conventional
Estimated Equity
$284,649
Purchase Details
Closed on
Dec 10, 2009
Sold by
Zwierzchowski Thomas J and Zwierchowski Katherine I
Bought by
Zwierzchowski Thomas J and Zwierchowski Katherine I
Purchase Details
Closed on
Jun 19, 2009
Sold by
Pfannes Andrew and Pfannes Jayme
Bought by
Zwierzchowski Thomas J and Stoll Katherine I
Purchase Details
Closed on
Aug 20, 2003
Sold by
Wandzel Jeffrey T and Wandzel Catherine M
Bought by
Pfannes Andrew and Pfannes Jayme
Purchase Details
Closed on
Sep 22, 1999
Sold by
Bennett Danny L
Bought by
Wandzel Jeffrey T
Create a Home Valuation Report for This Property
The Home Valuation Report is an in-depth analysis detailing your home's value as well as a comparison with similar homes in the area
Home Values in the Area
Average Home Value in this Area
Purchase History
| Date | Buyer | Sale Price | Title Company |
|---|---|---|---|
| Trice Susan J | $137,500 | None Available | |
| Zwierzchowski Thomas J | -- | None Available | |
| Zwierzchowski Thomas J | $146,000 | Philip R Seaver Title Co Inc | |
| Pfannes Andrew | $195,000 | Colonial Title Co | |
| Wandzel Jeffrey T | $179,900 | -- |
Source: Public Records
Mortgage History
| Date | Status | Borrower | Loan Amount |
|---|---|---|---|
| Open | Trice Susan J | $110,000 |
Source: Public Records
Tax History Compared to Growth
Tax History
| Year | Tax Paid | Tax Assessment Tax Assessment Total Assessment is a certain percentage of the fair market value that is determined by local assessors to be the total taxable value of land and additions on the property. | Land | Improvement |
|---|---|---|---|---|
| 2025 | $5,375 | $159,800 | $0 | $0 |
| 2024 | $3,205 | $150,500 | $0 | $0 |
| 2023 | $2,609 | $132,100 | $0 | $0 |
| 2022 | $4,017 | $117,100 | $0 | $0 |
| 2021 | $4,375 | $112,800 | $0 | $0 |
| 2020 | $2,571 | $111,500 | $0 | $0 |
| 2019 | $3,904 | $108,500 | $0 | $0 |
| 2018 | $3,692 | $102,600 | $0 | $0 |
| 2017 | $3,759 | $97,700 | $25,500 | $72,200 |
| 2016 | $3,467 | $97,700 | $0 | $0 |
| 2015 | -- | $91,700 | $0 | $0 |
| 2014 | -- | $86,200 | $0 | $0 |
| 2011 | -- | $79,300 | $20,700 | $58,600 |
Source: Public Records
Map
Nearby Homes
- 20784 Cannon Dr
- 20757 Cueter Ln
- 43440 Riverbend Blvd
- 43378 Riverbend Blvd
- 20654 Dunham Rd Unit 24
- 44000 Dunham Ct
- 20561 Longwood Dr Unit 64
- 20465 Saint Laurence Dr
- 0 Clinton River Rd Unit 20251013874
- 43300 Little Rd
- 44130 Cadburry Dr
- 42328 Sheridan Ct
- 43377 Rivergate Dr
- 19790 Westchester Dr Unit 11
- 20387 Villa Grande Cir Unit 19
- 42243 Little Rd
- 43363 Herring Dr
- 42680 Chippewa Dr Unit 28
- 20445 Villa Grande Cir Unit 48
- 42125 Little Rd
- 43481 Devin Dr
- 43525 Devin Dr
- 43500 Petrucci Dr
- 43547 Devin Dr
- 43459 Devin Dr
- 43478 Petrucci Dr
- 43522 Petrucci Dr
- 43456 Petrucci Dr
- 43544 Petrucci Dr
- 43502 Devin Dr
- 43480 Devin Dr
- 43569 Devin Dr
- 43524 Devin Dr
- 43437 Devin Dr
- 43458 Devin Dr
- 43546 Devin Dr
- 43434 Petrucci Dr
- 43566 Petrucci Dr
- 43436 Devin Dr
- 43591 Devin Dr