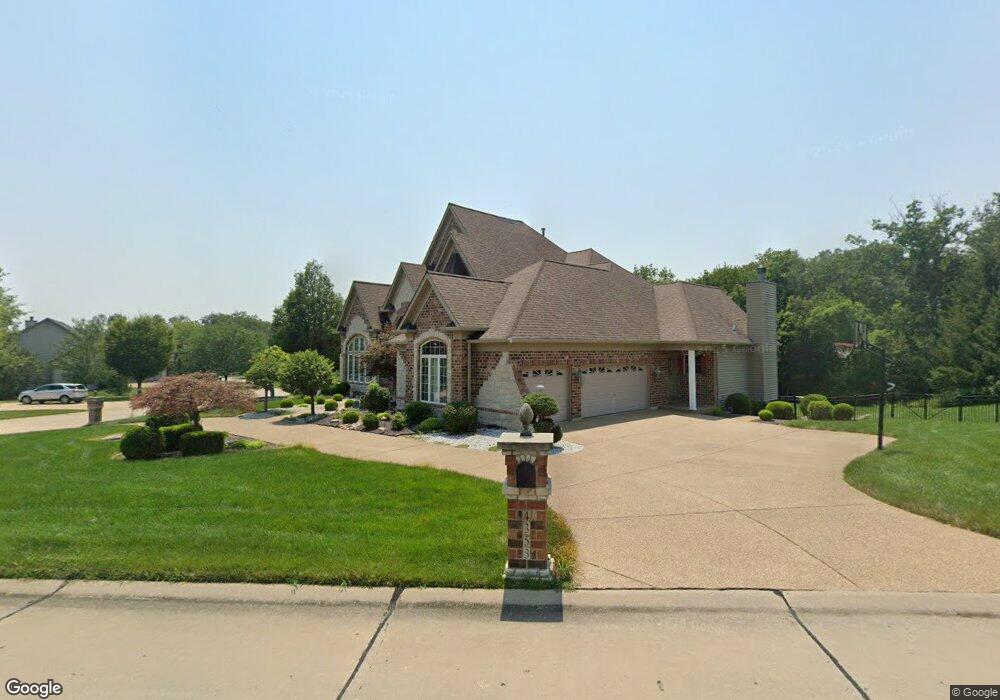
4353 Austin Pass Dr Saint Charles, MO 63304
Estimated Value: $1,035,000 - $1,243,000
5
Beds
5
Baths
3,984
Sq Ft
$289/Sq Ft
Est. Value
About This Home
This home is located at 4353 Austin Pass Dr, Saint Charles, MO 63304 and is currently estimated at $1,153,149, approximately $289 per square foot. 4353 Austin Pass Dr is a home located in St. Charles County with nearby schools including Independence Elementary School, Bryan Middle School, and Francis Howell Union High School.
Ownership History
Date
Name
Owned For
Owner Type
Purchase Details
Closed on
Jul 16, 2012
Sold by
Wachter Scott D and Wachter Veronica
Bought by
Nguyen Ken and Nguyen Amy R
Current Estimated Value
Home Financials for this Owner
Home Financials are based on the most recent Mortgage that was taken out on this home.
Original Mortgage
$480,000
Outstanding Balance
$330,935
Interest Rate
3.72%
Mortgage Type
New Conventional
Estimated Equity
$822,214
Purchase Details
Closed on
Mar 15, 2007
Sold by
Wachter Scott D and Wachter Veronica K
Bought by
Wachter Scott D and Wachter Veronica K
Home Financials for this Owner
Home Financials are based on the most recent Mortgage that was taken out on this home.
Original Mortgage
$750,000
Interest Rate
6.24%
Mortgage Type
New Conventional
Purchase Details
Closed on
Dec 15, 2004
Sold by
Arbor Homes Inc
Bought by
Wachter Scott D
Home Financials for this Owner
Home Financials are based on the most recent Mortgage that was taken out on this home.
Original Mortgage
$542,950
Interest Rate
4.75%
Mortgage Type
Purchase Money Mortgage
Create a Home Valuation Report for This Property
The Home Valuation Report is an in-depth analysis detailing your home's value as well as a comparison with similar homes in the area
Home Values in the Area
Average Home Value in this Area
Purchase History
| Date | Buyer | Sale Price | Title Company |
|---|---|---|---|
| Nguyen Ken | $600,000 | None Available | |
| Wachter Scott D | -- | Multiple | |
| Wachter Scott D | -- | Enterprise Land Title Co |
Source: Public Records
Mortgage History
| Date | Status | Borrower | Loan Amount |
|---|---|---|---|
| Open | Nguyen Ken | $480,000 | |
| Previous Owner | Wachter Scott D | $750,000 | |
| Previous Owner | Wachter Scott D | $542,950 | |
| Closed | Wachter Scott D | $68,000 |
Source: Public Records
Tax History Compared to Growth
Tax History
| Year | Tax Paid | Tax Assessment Tax Assessment Total Assessment is a certain percentage of the fair market value that is determined by local assessors to be the total taxable value of land and additions on the property. | Land | Improvement |
|---|---|---|---|---|
| 2025 | $10,266 | $192,599 | -- | -- |
| 2024 | $10,266 | $172,680 | -- | -- |
| 2023 | $10,261 | $172,680 | $0 | $0 |
| 2022 | $9,703 | $151,698 | $0 | $0 |
| 2021 | $9,712 | $151,698 | $0 | $0 |
| 2020 | $9,256 | $139,943 | $0 | $0 |
| 2019 | $9,214 | $139,943 | $0 | $0 |
| 2018 | $9,592 | $139,324 | $0 | $0 |
| 2017 | $9,513 | $139,324 | $0 | $0 |
| 2016 | $9,503 | $134,058 | $0 | $0 |
| 2015 | $9,455 | $134,058 | $0 | $0 |
| 2014 | $9,237 | $127,038 | $0 | $0 |
Source: Public Records
Map
Nearby Homes
- 4 Upper Whitmoor Dr
- 1094 Whitmoor Dr
- 42 Windcastle Place
- 263 Ashdown Forest Ct
- 64 Castle Bluff Dr
- 149 Shaelah Ct
- 191 Muirfield Forest Ct
- 42 Windam Place Dr
- 142 Newgrange Pass
- 74 W Meath Ring
- 801 Haversham Dr
- 5070 Douglas Park Dr
- 3912 Jacobs Landing
- 950 Haversham Dr
- 32 Clarksburg Ct
- 180 Wholesome Way
- 74 Mondavi Ct
- 828 Nancy Ln
- 0 Unknown Unit MIS25045732
- 0 Unknown Unit MIS25045735
- 4556 Austin Knoll Ct
- 4361 Austin Pass Dr
- 4352 Austin Pass Dr
- 4480 Austin Valley Ct
- 4345 Austin Pass Dr
- 4560 Austin Knoll Ct
- 4369 Austin Pass Dr
- 4388 Austin Ridge Ct
- 4561 Austin Knoll Ct
- 4484 Austin Valley Ct
- 4481 Austin Valley Ct
- 4505 Austin Point Ct
- 4373 Austin Pass Dr
- 78 Lot 78 Austin Pass Dr
- 0 Lot 78@austin Ridge Unit 80055430
- 4564 Austin Knoll Ct
- 4341 Austin Pass Dr
- 4567 Austin Knoll Ct
- 4504 Austin Point Ct
- 4340 Austin Pass Dr