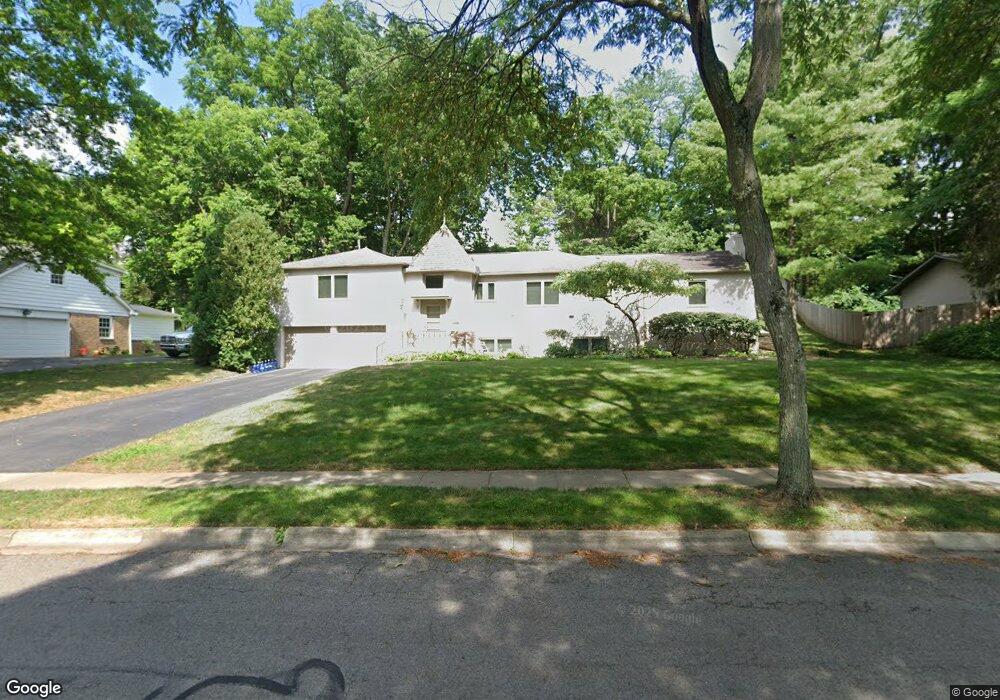
4356 Langport Rd Columbus, OH 43220
Estimated Value: $739,000 - $967,000
4
Beds
4
Baths
2,284
Sq Ft
$371/Sq Ft
Est. Value
About This Home
This home is located at 4356 Langport Rd, Columbus, OH 43220 and is currently estimated at $846,410, approximately $370 per square foot. 4356 Langport Rd is a home located in Franklin County with nearby schools including Windermere Elementary School, Hastings Middle School, and Upper Arlington High School.
Ownership History
Date
Name
Owned For
Owner Type
Purchase Details
Closed on
Sep 16, 2021
Sold by
Adrion Andrew G and Adrion Lisa M
Bought by
Adrion Lisa M
Current Estimated Value
Purchase Details
Closed on
Feb 18, 2021
Sold by
Adrion Andrew G and Adrion Lisa M
Bought by
Adrion Andrew G and Adrion Lisa M
Purchase Details
Closed on
May 19, 2009
Sold by
Adrion Andrew G and Adrion Lisa M
Bought by
Adrion Andrew G and Adrion Lisa M
Purchase Details
Closed on
May 7, 2009
Sold by
Adrion William R and Adrion June A
Bought by
Adrion Andrew G
Purchase Details
Closed on
Mar 16, 2001
Sold by
Adrion William R and Adrion June A
Bought by
Adrion William R and Adrion June A
Purchase Details
Closed on
Dec 5, 1991
Bought by
Adrion William R and Adrion June A
Create a Home Valuation Report for This Property
The Home Valuation Report is an in-depth analysis detailing your home's value as well as a comparison with similar homes in the area
Home Values in the Area
Average Home Value in this Area
Purchase History
| Date | Buyer | Sale Price | Title Company |
|---|---|---|---|
| Adrion Lisa M | -- | None Available | |
| Adrion Andrew G | -- | None Available | |
| Adrion Andrew G | -- | Attorney | |
| Adrion Andrew G | -- | Attorney | |
| Adrion William R | -- | Attorney | |
| Adrion William R | -- | -- | |
| Adrion William R | $219,700 | -- |
Source: Public Records
Tax History Compared to Growth
Tax History
| Year | Tax Paid | Tax Assessment Tax Assessment Total Assessment is a certain percentage of the fair market value that is determined by local assessors to be the total taxable value of land and additions on the property. | Land | Improvement |
|---|---|---|---|---|
| 2024 | $13,675 | $236,220 | $92,050 | $144,170 |
| 2023 | $13,506 | $236,220 | $92,050 | $144,170 |
| 2022 | $13,347 | $185,260 | $65,800 | $119,460 |
| 2021 | $11,460 | $185,260 | $65,800 | $119,460 |
| 2020 | $11,358 | $185,260 | $65,800 | $119,460 |
| 2019 | $10,648 | $153,550 | $65,800 | $87,750 |
| 2018 | $10,007 | $153,550 | $65,800 | $87,750 |
| 2017 | $10,001 | $153,550 | $65,800 | $87,750 |
| 2016 | $9,435 | $142,700 | $52,710 | $89,990 |
| 2015 | $9,427 | $142,700 | $52,710 | $89,990 |
| 2014 | $9,438 | $142,700 | $52,710 | $89,990 |
| 2013 | $4,506 | $129,710 | $47,915 | $81,795 |
Source: Public Records
Map
Nearby Homes
- 4371 Latin Ln Unit 122
- 4540 Langport Rd
- 2681 Lane Rd
- 4270 Llanfair Ct
- 3950 Riverside Dr
- 4450 Haverford Ct
- 3055 Carriage Ln
- 4115 Woodbridge Rd
- 3959 Woodbridge Rd
- 4390 Dublin Rd
- 4025 Dublin Rd
- 2300 Hoxton Ct
- 3830 Riverview Dr
- 3320 Scioto Run Blvd
- 4765 Coach Rd
- 2231 Atlee Ct Unit 12
- 4400 Dublin Rd
- 2198 Sandston Rd
- 2458 Edgevale Rd
- 2165 Partlow Dr
- 4370 Langport Rd
- 4340 Langport Rd
- 2644 Clairmont Ct
- 2634 Clairmont Ct
- 4351 Langport Rd
- 2635 Clairmont Ct
- 2671 Alliston Ct
- 2691 Alliston Ct
- 4333 Langport Rd
- 2706 Lymington Rd
- 2711 Lymington Rd
- 2661 Alliston Ct
- 2626 Clairmont Ct
- 2625 Clairmont Ct
- 4385 Langport Rd
- 2710 Folkstone Rd
- 2681 Folkstone Rd
- 2720 Lymington Rd
- 2650 Mccoy Rd
- 0 Alliston Ct