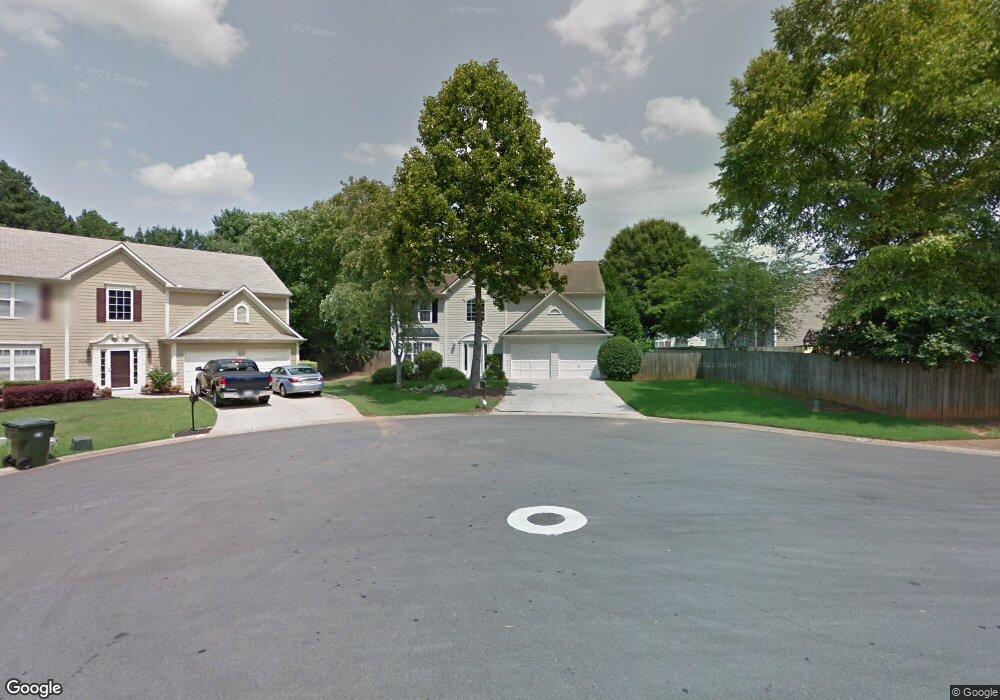
4358 Sentinel Place NW Kennesaw, GA 30144
Estimated Value: $413,196 - $457,000
3
Beds
3
Baths
2,293
Sq Ft
$188/Sq Ft
Est. Value
About This Home
This home is located at 4358 Sentinel Place NW, Kennesaw, GA 30144 and is currently estimated at $431,799, approximately $188 per square foot. 4358 Sentinel Place NW is a home located in Cobb County with nearby schools including Kennesaw Elementary School, Big Shanty Elementary School, and Awtrey Middle School.
Ownership History
Date
Name
Owned For
Owner Type
Purchase Details
Closed on
Aug 4, 2015
Sold by
Kfc Properties Llc
Bought by
Callaham Kenneth F
Current Estimated Value
Purchase Details
Closed on
Feb 12, 2010
Sold by
Mitchener William
Bought by
Kfc Props Llc
Purchase Details
Closed on
Jul 19, 2004
Sold by
Edmunds Kristine D and Edmunds James L
Bought by
Mitchener William
Home Financials for this Owner
Home Financials are based on the most recent Mortgage that was taken out on this home.
Original Mortgage
$162,000
Interest Rate
6.24%
Mortgage Type
New Conventional
Purchase Details
Closed on
Feb 24, 1999
Sold by
Albee Amity C
Bought by
Edmunds Krisyine D and Edmunds James
Home Financials for this Owner
Home Financials are based on the most recent Mortgage that was taken out on this home.
Original Mortgage
$119,700
Interest Rate
6.84%
Mortgage Type
New Conventional
Purchase Details
Closed on
Jun 27, 1996
Sold by
Torrey S G Atlanta Ltd
Bought by
Albee Amity C
Create a Home Valuation Report for This Property
The Home Valuation Report is an in-depth analysis detailing your home's value as well as a comparison with similar homes in the area
Home Values in the Area
Average Home Value in this Area
Purchase History
| Date | Buyer | Sale Price | Title Company |
|---|---|---|---|
| Callaham Kenneth F | -- | -- | |
| Kfc Props Llc | $145,500 | -- | |
| Mitchener William | $162,000 | -- | |
| Edmunds Krisyine D | $133,000 | -- | |
| Albee Amity C | $127,000 | -- |
Source: Public Records
Mortgage History
| Date | Status | Borrower | Loan Amount |
|---|---|---|---|
| Previous Owner | Mitchener William | $162,000 | |
| Previous Owner | Edmunds Krisyine D | $119,700 | |
| Closed | Albee Amity C | $0 |
Source: Public Records
Tax History Compared to Growth
Tax History
| Year | Tax Paid | Tax Assessment Tax Assessment Total Assessment is a certain percentage of the fair market value that is determined by local assessors to be the total taxable value of land and additions on the property. | Land | Improvement |
|---|---|---|---|---|
| 2025 | $5,213 | $173,012 | $34,000 | $139,012 |
| 2024 | $5,216 | $173,012 | $34,000 | $139,012 |
| 2023 | $4,286 | $142,168 | $24,000 | $118,168 |
| 2022 | $4,315 | $142,168 | $24,000 | $118,168 |
| 2021 | $3,086 | $101,688 | $24,000 | $77,688 |
| 2020 | $3,958 | $99,328 | $24,000 | $75,328 |
| 2019 | $2,901 | $95,592 | $24,000 | $71,592 |
| 2018 | $2,591 | $85,360 | $24,000 | $61,360 |
| 2017 | $2,093 | $72,788 | $16,000 | $56,788 |
| 2016 | $2,093 | $72,788 | $16,000 | $56,788 |
| 2015 | $2,030 | $68,920 | $16,000 | $52,920 |
| 2014 | $2,048 | $68,920 | $0 | $0 |
Source: Public Records
Map
Nearby Homes
- 4851 Lake Park Ln
- 4424 High Gate Dr NW
- 3038 Fairhaven Ridge NW
- 4317 Chesapeake Trace NW
- 2617 Lake Park Bend
- 4348 Richmond Place NW Unit 1
- 4476 High Gate Ct NW
- 4179 Gramercy Main NW
- 4518 Columbus Cir
- 4157 Berkeley Landing NW
- 2698 Claredon Trace NW
- 4591 Grenadine Cir
- 4514 Lake Park Dr
- 4210 Steeplehill Dr NW
- 3324 Whitmore Ct
- 4336 Thorngate Ln
- 2740 Lake Park Ridge W
- 4561 Grenadine Cir
- 2773 Northgate Way NW Unit 1
- 2982 Downing Ln NW
- 2980 Downing Ln NW
- 4360 Sentinel Place NW
- 4303 Brighton Ct NW
- 4305 Brighton Ct NW
- 2984 Downing Ln NW
- 4362 Sentinel Place NW
- 0 Downing Ln NW Unit 7406749
- 0 Downing Ln NW Unit 8175649
- 0 Downing Ln NW
- 4304 Brighton Ct NW
- 2986 Downing Ln NW
- 4361 Sentinel Place NW
- 4363 Sentinel Place NW
- 4359 Sentinel Place NW
- 4354 Sentinel Place NW
- 4365 Sentinel Place NW
- 4357 Sentinel Place NW
- 4253 Brighton Way NW
- 4302 Brighton Ct NW Unit 61