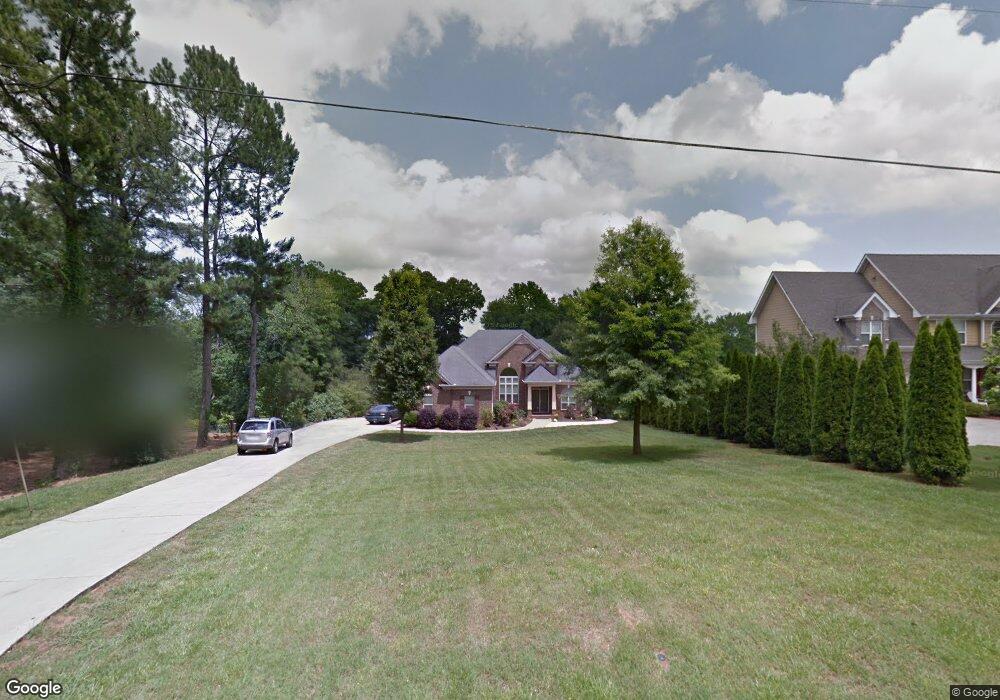
4359 Benefield Rd Braselton, GA 30517
Estimated Value: $316,000 - $392,000
3
Beds
2
Baths
1,718
Sq Ft
$210/Sq Ft
Est. Value
About This Home
This home is located at 4359 Benefield Rd, Braselton, GA 30517 and is currently estimated at $359,982, approximately $209 per square foot. 4359 Benefield Rd is a home located in Hall County with nearby schools including Chestnut Mountain Elementary School, Cherokee Bluff Middle School, and Cherokee Bluff High School.
Ownership History
Date
Name
Owned For
Owner Type
Purchase Details
Closed on
Jan 22, 2021
Sold by
Foster Stanley R
Bought by
Hoskins Margaret Ann
Current Estimated Value
Home Financials for this Owner
Home Financials are based on the most recent Mortgage that was taken out on this home.
Original Mortgage
$110,000
Outstanding Balance
$62,207
Interest Rate
2.6%
Mortgage Type
New Conventional
Estimated Equity
$297,775
Purchase Details
Closed on
Aug 23, 2012
Sold by
Mayo Kelly Suzanne Nabb
Bought by
Foster Stanley R and 4359 Benefield Road Land Trust
Home Financials for this Owner
Home Financials are based on the most recent Mortgage that was taken out on this home.
Original Mortgage
$30,664
Interest Rate
3.53%
Mortgage Type
New Conventional
Purchase Details
Closed on
Jun 29, 2011
Sold by
Mayo Brent F
Bought by
Mayo Kelly S N
Purchase Details
Closed on
Dec 16, 2003
Sold by
Davis Spencer E and Davis Beverly M
Bought by
Nabb Kelly
Create a Home Valuation Report for This Property
The Home Valuation Report is an in-depth analysis detailing your home's value as well as a comparison with similar homes in the area
Home Values in the Area
Average Home Value in this Area
Purchase History
| Date | Buyer | Sale Price | Title Company |
|---|---|---|---|
| Hoskins Margaret Ann | -- | -- | |
| Hoskins Margaret Ann | $80,318 | -- | |
| Foster Stanley R | $155,000 | -- | |
| Mayo Kelly S N | -- | -- | |
| Nabb Kelly | $35,000 | -- |
Source: Public Records
Mortgage History
| Date | Status | Borrower | Loan Amount |
|---|---|---|---|
| Open | Hoskins Margaret Ann | $110,000 | |
| Closed | Hoskins Margaret Ann | $110,000 | |
| Previous Owner | Foster Stanley R | $30,664 |
Source: Public Records
Tax History Compared to Growth
Tax History
| Year | Tax Paid | Tax Assessment Tax Assessment Total Assessment is a certain percentage of the fair market value that is determined by local assessors to be the total taxable value of land and additions on the property. | Land | Improvement |
|---|---|---|---|---|
| 2024 | $3,863 | $153,560 | $22,760 | $130,800 |
| 2023 | $3,668 | $145,640 | $22,760 | $122,880 |
| 2022 | $3,085 | $117,040 | $11,880 | $105,160 |
| 2021 | $2,667 | $98,880 | $7,840 | $91,040 |
| 2020 | $2,704 | $97,400 | $10,440 | $86,960 |
| 2019 | $2,578 | $91,880 | $10,440 | $81,440 |
| 2018 | $2,364 | $81,320 | $9,120 | $72,200 |
| 2017 | $2,245 | $77,920 | $13,680 | $64,240 |
| 2016 | $1,304 | $45,257 | $10,920 | $34,337 |
| 2015 | $1,315 | $45,257 | $10,920 | $34,337 |
| 2014 | $1,315 | $45,257 | $10,920 | $34,337 |
Source: Public Records
Map
Nearby Homes
- 1060 Regency Park Dr Unit 11
- 2824 Cork St
- 5387 Ponderosa Farm Rd
- 4404 Tanners Mill Rd
- 3945 Kilgore Falls Dr
- 0 Highway 53 Unit 10606336
- 5362 Windridge Pkwy
- 5350 Windridge Pkwy
- 5362 Windridge Pkwy Unit 168A
- 5350 Windridge Pkwy Unit 25A
- 5333 Windridge Pkwy
- 5333 Windridge Pkwy Unit 220A
- 5326 Windridge Pkwy Unit 19A
- 5326 Windridge Pkwy
- 5322 Windridge Pkwy Unit 18A
- 5247 Baymont Dr
- 5251 Baymont Dr
- 5247 Baymont Dr Unit 162A
- 5251 Baymont Dr Unit 161A
- 5255 Baymont Dr
- 4361 Benefield Rd
- 4365 Benefield Rd
- 4370 Benefield Rd
- 4333 Benefield Rd
- 4336 Benefield Rd
- 4337 Benefield Rd
- 4328 Benefield Rd Unit 11
- 4391 Benefield Rd
- 4311 Benefield Rd
- 4335 Benefield Rd
- 4387 Benefield Rd
- 4316 Benefield Rd
- 4324 Benefield Rd
- 4320 Benefield Rd
- 4310 Benefield Rd
- 4409 Benefield Rd
- 4362 Benefield Cir
- 4417 Benefield Rd
- 4355 Benefield Rd
- 4420 Benefield Rd