Estimated Value: $734,000 - $924,000
6
Beds
5
Baths
5,011
Sq Ft
$173/Sq Ft
Est. Value
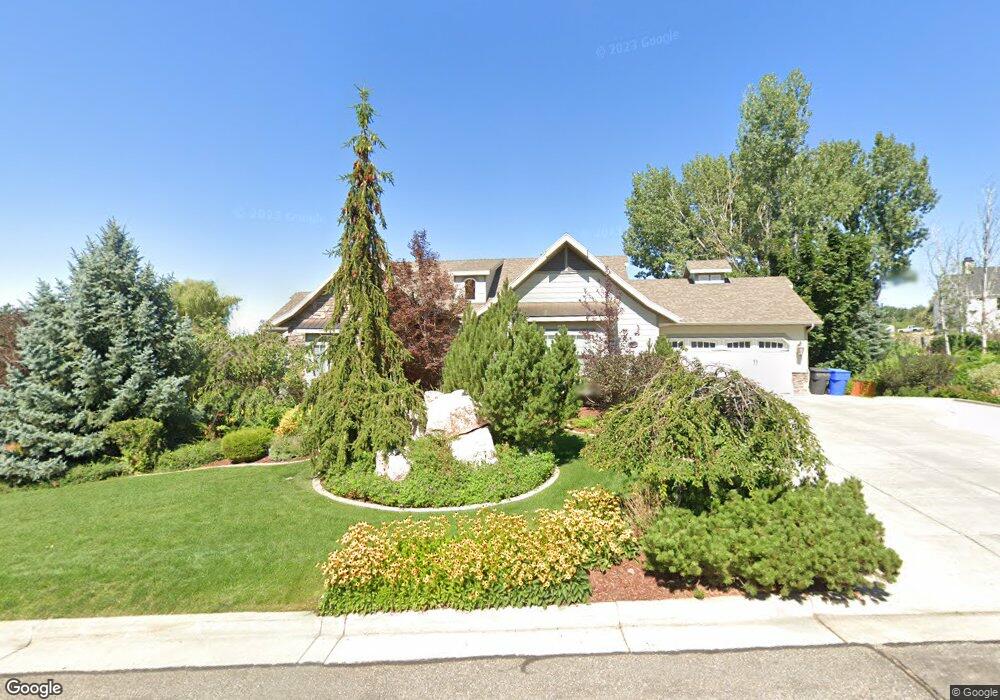
About This Home
This home is located at 4359 N 175 W, Ogden, UT 84414 and is currently estimated at $869,336, approximately $173 per square foot. 4359 N 175 W is a home located in Weber County with nearby schools including Lomond View School, Orion Junior High School, and Weber High School.
Ownership History
Date
Name
Owned For
Owner Type
Purchase Details
Closed on
Jul 3, 2008
Sold by
Lichfield Jason B and Lichfield Sherri K
Bought by
Dahlin Eric K
Current Estimated Value
Create a Home Valuation Report for This Property
The Home Valuation Report is an in-depth analysis detailing your home's value as well as a comparison with similar homes in the area
Home Values in the Area
Average Home Value in this Area
Purchase History
| Date | Buyer | Sale Price | Title Company |
|---|---|---|---|
| Dahlin Eric K | -- | Atlas Title Salt Lake |
Source: Public Records
Tax History Compared to Growth
Tax History
| Year | Tax Paid | Tax Assessment Tax Assessment Total Assessment is a certain percentage of the fair market value that is determined by local assessors to be the total taxable value of land and additions on the property. | Land | Improvement |
|---|---|---|---|---|
| 2025 | $5,656 | $875,628 | $193,855 | $681,773 |
| 2024 | $5,447 | $472,449 | $106,620 | $365,829 |
| 2023 | $5,657 | $497,199 | $106,139 | $391,060 |
| 2022 | $5,812 | $525,250 | $95,053 | $430,197 |
| 2021 | $4,578 | $691,999 | $102,236 | $589,763 |
| 2020 | $4,031 | $558,000 | $91,609 | $466,391 |
| 2019 | $3,981 | $571,002 | $81,457 | $489,545 |
| 2018 | $4,439 | $570,000 | $63,334 | $506,666 |
| 2017 | $4,034 | $486,000 | $63,334 | $422,666 |
| 2016 | $3,638 | $237,273 | $33,458 | $203,815 |
| 2015 | $3,243 | $207,324 | $36,827 | $170,497 |
| 2014 | $3,143 | $196,999 | $36,827 | $160,172 |
Source: Public Records
Map
Nearby Homes