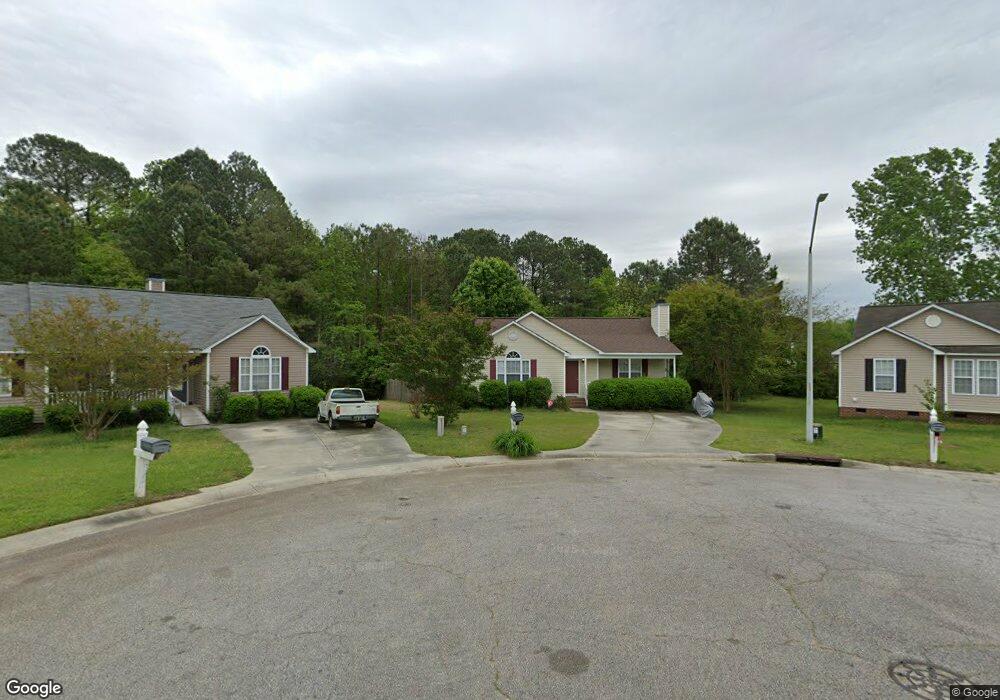
436 Barn View Ct Fuquay Varina, NC 27526
Estimated Value: $306,000 - $318,213
3
Beds
2
Baths
1,225
Sq Ft
$254/Sq Ft
Est. Value
About This Home
This home is located at 436 Barn View Ct, Fuquay Varina, NC 27526 and is currently estimated at $310,553, approximately $253 per square foot. 436 Barn View Ct is a home located in Wake County with nearby schools including Achievement Charter Academy and Learning Time Academy.
Ownership History
Date
Name
Owned For
Owner Type
Purchase Details
Closed on
Jun 19, 2025
Sold by
Mde Living Trust and Mae Living Trust
Bought by
Edmonds Ventures Llc
Current Estimated Value
Purchase Details
Closed on
Jan 12, 2023
Sold by
Edmonds Michael D and Edmonds Melisa
Bought by
Mae Living Trust
Purchase Details
Closed on
Aug 17, 2018
Sold by
Moya Astudillo Carlos and Moya Astudillo Johanna
Bought by
Edmonds Michael D and Edmonds Melisa
Home Financials for this Owner
Home Financials are based on the most recent Mortgage that was taken out on this home.
Original Mortgage
$135,000
Interest Rate
4.5%
Mortgage Type
New Conventional
Purchase Details
Closed on
Dec 23, 2004
Sold by
Comfort Homes Inc
Bought by
Barroso Johana U
Home Financials for this Owner
Home Financials are based on the most recent Mortgage that was taken out on this home.
Original Mortgage
$111,500
Interest Rate
5.67%
Mortgage Type
Fannie Mae Freddie Mac
Create a Home Valuation Report for This Property
The Home Valuation Report is an in-depth analysis detailing your home's value as well as a comparison with similar homes in the area
Home Values in the Area
Average Home Value in this Area
Purchase History
| Date | Buyer | Sale Price | Title Company |
|---|---|---|---|
| Edmonds Ventures Llc | -- | None Listed On Document | |
| Edmonds Ventures Llc | -- | None Listed On Document | |
| Mae Living Trust | -- | -- | |
| Edmonds Michael D | $180,000 | None Available | |
| Barroso Johana U | $113,000 | -- |
Source: Public Records
Mortgage History
| Date | Status | Borrower | Loan Amount |
|---|---|---|---|
| Previous Owner | Edmonds Michael D | $135,000 | |
| Previous Owner | Barroso Johana U | $111,500 |
Source: Public Records
Tax History Compared to Growth
Tax History
| Year | Tax Paid | Tax Assessment Tax Assessment Total Assessment is a certain percentage of the fair market value that is determined by local assessors to be the total taxable value of land and additions on the property. | Land | Improvement |
|---|---|---|---|---|
| 2025 | $2,654 | $301,013 | $90,000 | $211,013 |
| 2024 | $2,643 | $301,013 | $90,000 | $211,013 |
| 2023 | $2,030 | $180,750 | $50,000 | $130,750 |
| 2022 | $1,908 | $180,750 | $50,000 | $130,750 |
| 2021 | $1,818 | $180,750 | $50,000 | $130,750 |
| 2020 | $1,818 | $180,750 | $50,000 | $130,750 |
| 2019 | $1,641 | $140,556 | $45,000 | $95,556 |
| 2018 | $0 | $140,556 | $45,000 | $95,556 |
| 2017 | $1,492 | $140,556 | $45,000 | $95,556 |
| 2016 | $1,472 | $140,556 | $45,000 | $95,556 |
| 2015 | $1,371 | $135,181 | $44,000 | $91,181 |
| 2014 | -- | $135,181 | $44,000 | $91,181 |
Source: Public Records
Map
Nearby Homes
- 432 Barn View Ct
- 1012 S Willhaven Dr
- 1008 S Fieldhaven Dr
- 1024 S Philwood Ct
- 733 Bluffcreek Dr
- 704 Valleywater St
- 912 Field Ivy Dr
- 1128 Crystalwater Dr
- 905 Lily Claire Ln
- 912 Lily Claire Ln
- 1014 S Main St
- 1612 S Main St
- 516 Barneswyck Dr
- 70 Saintsbury Dr
- 56 Saintsbury Dr
- 233 Theys Mill Way
- 747 Creekway Dr
- 553 Barneswyck Dr
- 548 Barneswyck Dr
- 1000 Lily Claire Ln
- 440 Barn View Ct
- 433 Haybale Ct
- 433 Barn View Ct
- 428 Barn View Ct
- 436 Haybale Ct
- 429 Barn View Ct
- 441 Henwood Ct
- 1005 S Willhaven Dr
- 421 Haybale Ct
- 424 Barn View Ct
- 464 Henwood Ct
- 911 S Philwood Ct
- 425 Barn View Ct
- 432 Haybale Ct
- 437 Henwood Ct
- 460 Henwood Ct
- 421 Barn View Ct
- 428 Haybale Ct
- 913 S Philwood Ct
- 424 Haybale Ct