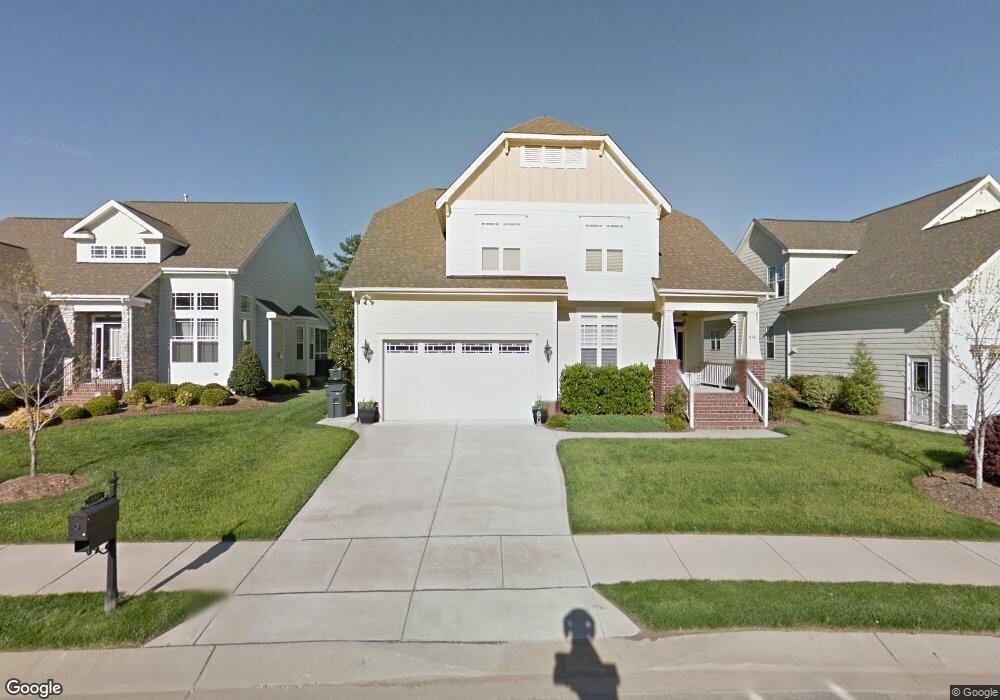
436 Beckwith Ave Unit L5 Clayton, NC 27527
Wilders NeighborhoodEstimated Value: $436,364 - $491,000
3
Beds
3
Baths
2,385
Sq Ft
$196/Sq Ft
Est. Value
About This Home
This home is located at 436 Beckwith Ave Unit L5, Clayton, NC 27527 and is currently estimated at $466,341, approximately $195 per square foot. 436 Beckwith Ave Unit L5 is a home located in Johnston County with nearby schools including River Dell Elementary School, Archer Lodge Middle School, and Corinth Holders High School.
Ownership History
Date
Name
Owned For
Owner Type
Purchase Details
Closed on
Jul 7, 2020
Sold by
Trotta Gina
Bought by
Mcdonald Matthew Jerome and Mcdonald Selisa Page
Current Estimated Value
Home Financials for this Owner
Home Financials are based on the most recent Mortgage that was taken out on this home.
Original Mortgage
$249,050
Outstanding Balance
$220,841
Interest Rate
3.1%
Mortgage Type
New Conventional
Estimated Equity
$245,500
Purchase Details
Closed on
Jul 14, 2010
Sold by
Crescent State Bank
Bought by
Trotta Gina and Trotta Gina M
Home Financials for this Owner
Home Financials are based on the most recent Mortgage that was taken out on this home.
Original Mortgage
$207,000
Interest Rate
4.61%
Mortgage Type
VA
Purchase Details
Closed on
Jan 15, 2010
Sold by
F&L Developers Inc
Bought by
Crescent State Bank
Create a Home Valuation Report for This Property
The Home Valuation Report is an in-depth analysis detailing your home's value as well as a comparison with similar homes in the area
Home Values in the Area
Average Home Value in this Area
Purchase History
| Date | Buyer | Sale Price | Title Company |
|---|---|---|---|
| Mcdonald Matthew Jerome | $293,000 | None Available | |
| Trotta Gina | $207,000 | None Available | |
| Crescent State Bank | $199,000 | None Available |
Source: Public Records
Mortgage History
| Date | Status | Borrower | Loan Amount |
|---|---|---|---|
| Open | Mcdonald Matthew Jerome | $249,050 | |
| Previous Owner | Trotta Gina | $207,000 |
Source: Public Records
Tax History Compared to Growth
Tax History
| Year | Tax Paid | Tax Assessment Tax Assessment Total Assessment is a certain percentage of the fair market value that is determined by local assessors to be the total taxable value of land and additions on the property. | Land | Improvement |
|---|---|---|---|---|
| 2025 | $2,728 | $429,640 | $80,000 | $349,640 |
| 2024 | $2,108 | $260,190 | $42,000 | $218,190 |
| 2023 | $2,108 | $260,190 | $42,000 | $218,190 |
| 2022 | $2,134 | $260,190 | $42,000 | $218,190 |
| 2021 | $2,134 | $260,190 | $42,000 | $218,190 |
| 2020 | $1,861 | $260,190 | $42,000 | $218,190 |
| 2019 | $1,864 | $260,190 | $42,000 | $218,190 |
| 2018 | $1,672 | $237,220 | $55,000 | $182,220 |
| 2017 | $1,634 | $237,220 | $55,000 | $182,220 |
| 2016 | $1,634 | $237,220 | $55,000 | $182,220 |
| 2015 | $1,746 | $237,220 | $55,000 | $182,220 |
| 2014 | $1,746 | $237,220 | $55,000 | $182,220 |
Source: Public Records
Map
Nearby Homes
- 362 Beckwith Ave
- 65 Balsam Ln
- 80 Bramble Ln
- 537 Bramble Ln
- 225 Beckwith Ave
- 59 Blue Spruce Cir
- 67 Blue Spruce Cir
- 112 River Dell Townes Ave
- 46 Woods Manor Ln
- 80 Willow Green Dr
- 67 Little Leaf Ln Unit 98
- 72 Little Leaf Ln
- 88 White Pine Dr
- 71 Little Leaf Ln Unit 99
- 366 Bramble Ln
- 85 Little Leaf Ln
- 91 Little Leaf Ln Unit 103
- 46 S Great White Way
- 47 White Pine Dr
- 107 Thornbury St
- 436 Beckwith Ave Unit Lot 5
- 436 Beckwith Ave
- 450 Beckwith Ave
- 450 Beckwith Ave Unit L6
- 426 Beckwith Ave
- 426 Beckwith Ave Unit L4
- 464 Beckwith Ave Unit 7
- 412 Beckwith Ave
- 412 Beckwith Ave Unit L3
- 476 Beckwith Ave
- 398 Beckwith Ave
- 398 Beckwith Ave Unit L2
- 20 Ellen Cir
- 461 Beckwith Ave Unit 36
- 461 Beckwith Ave
- 488 Beckwith Ave Unit 9
- 488 Beckwith Ave
- 107 Balsam Ln
- 27 Ellen Cir Unit 32
- 117 Balsam Ln