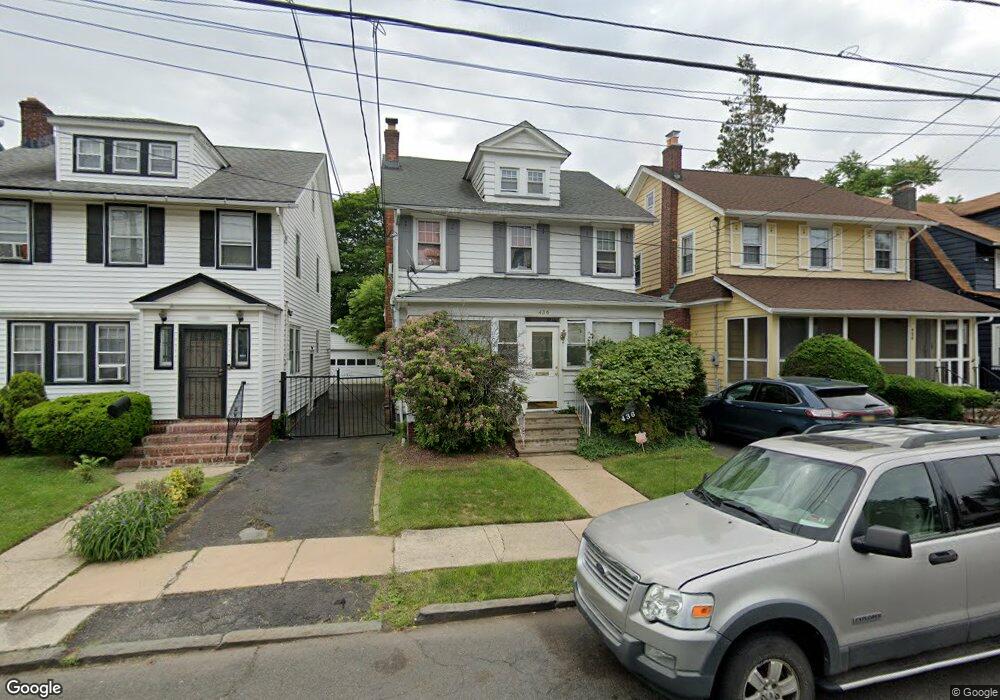
436 Chapman St Irvington, NJ 07111
Estimated Value: $394,302 - $561,000
--
Bed
--
Bath
1,441
Sq Ft
$320/Sq Ft
Est. Value
About This Home
This home is located at 436 Chapman St, Irvington, NJ 07111 and is currently estimated at $461,326, approximately $320 per square foot. 436 Chapman St is a home located in Essex County with nearby schools including Irvington High School and St. John the Baptist Ukraini.
Ownership History
Date
Name
Owned For
Owner Type
Purchase Details
Closed on
Dec 31, 2009
Sold by
Bouie Gene L and Bouie Debra Davis
Bought by
Bouie Debra Davis
Current Estimated Value
Purchase Details
Closed on
Dec 3, 1997
Sold by
Scales Laudess
Bought by
Bouie Gene and Davis Debra
Home Financials for this Owner
Home Financials are based on the most recent Mortgage that was taken out on this home.
Original Mortgage
$114,000
Outstanding Balance
$19,372
Interest Rate
7.28%
Mortgage Type
FHA
Estimated Equity
$441,954
Create a Home Valuation Report for This Property
The Home Valuation Report is an in-depth analysis detailing your home's value as well as a comparison with similar homes in the area
Home Values in the Area
Average Home Value in this Area
Purchase History
| Date | Buyer | Sale Price | Title Company |
|---|---|---|---|
| Bouie Debra Davis | -- | None Available | |
| Bouie Gene | $117,000 | -- |
Source: Public Records
Mortgage History
| Date | Status | Borrower | Loan Amount |
|---|---|---|---|
| Open | Bouie Gene | $114,000 |
Source: Public Records
Tax History Compared to Growth
Tax History
| Year | Tax Paid | Tax Assessment Tax Assessment Total Assessment is a certain percentage of the fair market value that is determined by local assessors to be the total taxable value of land and additions on the property. | Land | Improvement |
|---|---|---|---|---|
| 2025 | $8,423 | $367,800 | $152,900 | $214,900 |
| 2024 | $8,423 | $138,700 | $21,500 | $117,200 |
| 2022 | $8,268 | $138,700 | $21,500 | $117,200 |
| 2021 | $8,293 | $138,700 | $21,500 | $117,200 |
| 2020 | $8,289 | $138,700 | $21,500 | $117,200 |
| 2019 | $8,064 | $138,700 | $21,500 | $117,200 |
| 2018 | $7,907 | $138,700 | $21,500 | $117,200 |
| 2017 | $7,871 | $138,700 | $21,500 | $117,200 |
| 2016 | $7,701 | $138,700 | $21,500 | $117,200 |
| 2015 | $7,522 | $138,700 | $21,500 | $117,200 |
| 2014 | $7,567 | $138,700 | $21,500 | $117,200 |
Source: Public Records
Map
Nearby Homes
- 900 Sanford Ave Unit 902
- 889 Sanford Ave
- 40 Newton Place
- 1371 Clinton Ave Unit 1373
- 1373 Clinton Ave
- 24 Ridgewood Ave
- 183 Ellery Ave
- 90 Mountain View Place
- 101 Mountainview Place
- 213 Kerrigan Blvd
- 34 Sherman Place
- 43 Rich St
- 39 Grant Place
- 326-328 Eastern Pkwy
- 326 Eastern Pkwy Unit 328
- 39-41 Rich St
- 40 Clinton Terrace
- 307 Eastern Pkwy Unit 309
- 10 Sanford Terrace
- 1012 Sanford Ave
- 434 Chapman St
- 438 Chapman St
- 430 Chapman St
- 442 Chapman St
- 127 Hillside Terrace
- 428 Chapman St
- 125 Hillside Terrace
- 131 Hillside Terrace
- 121 Hillside Terrace
- 137 Hillside Terrace
- 426 Chapman St
- 119 Hillside Terrace
- 433 Chapman St Unit 435
- 437 Chapman St
- 141 Hillside Terrace
- 141 Hillside Terrace Unit 2
- 117 Hillside Terrace
- 422 Chapman St
- 429 Chapman St
- 427 Chapman St