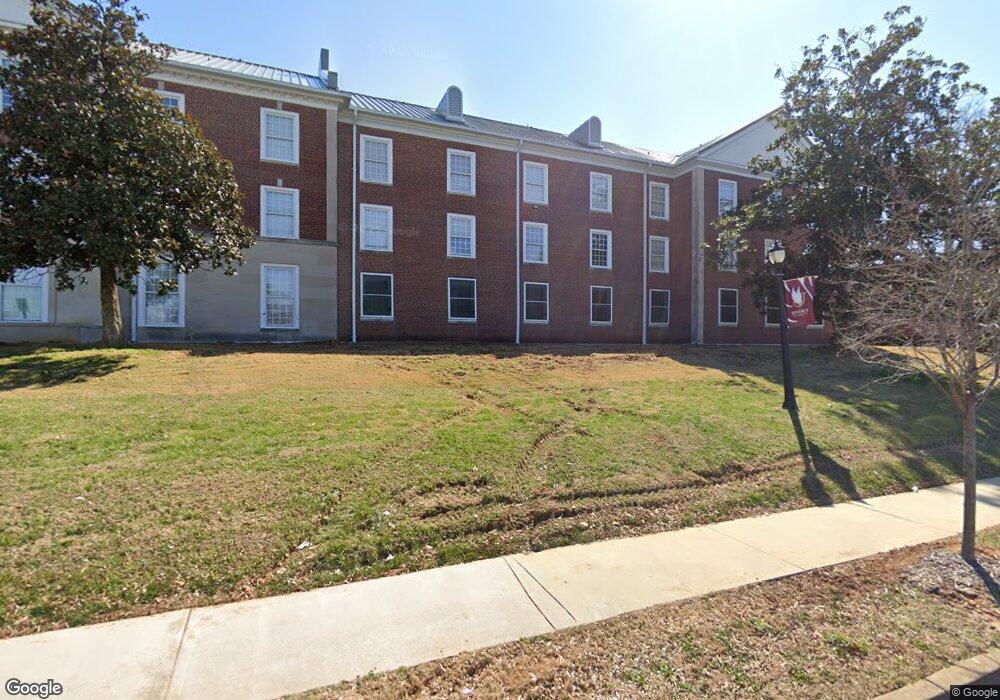
436 Cherry Rd S Unit 1-2 Rock Hill, SC 29732
Estimated Value: $386,957
--
Bed
--
Bath
3,111
Sq Ft
$124/Sq Ft
Est. Value
About This Home
This home is located at 436 Cherry Rd S Unit 1-2, Rock Hill, SC 29732 and is currently estimated at $386,957, approximately $124 per square foot. 436 Cherry Rd S Unit 1-2 is a home located in York County with nearby schools including York Road Elementary School, Dutchman Creek Middle School, and Northwestern High School.
Ownership History
Date
Name
Owned For
Owner Type
Purchase Details
Closed on
Feb 19, 2020
Sold by
Black Dog Capital Partners Llc
Bought by
Pahiena Properties Llc
Current Estimated Value
Home Financials for this Owner
Home Financials are based on the most recent Mortgage that was taken out on this home.
Original Mortgage
$175,000
Outstanding Balance
$154,950
Interest Rate
3.6%
Mortgage Type
Commercial
Estimated Equity
$232,007
Purchase Details
Closed on
Dec 30, 2016
Sold by
Burgess Bonnie N
Bought by
Black Dog Capital Partners Llc
Create a Home Valuation Report for This Property
The Home Valuation Report is an in-depth analysis detailing your home's value as well as a comparison with similar homes in the area
Home Values in the Area
Average Home Value in this Area
Purchase History
| Date | Buyer | Sale Price | Title Company |
|---|---|---|---|
| Pahiena Properties Llc | $250,000 | None Available | |
| Black Dog Capital Partners Llc | $115,500 | None Available |
Source: Public Records
Mortgage History
| Date | Status | Borrower | Loan Amount |
|---|---|---|---|
| Open | Pahiena Properties Llc | $175,000 |
Source: Public Records
Tax History Compared to Growth
Tax History
| Year | Tax Paid | Tax Assessment Tax Assessment Total Assessment is a certain percentage of the fair market value that is determined by local assessors to be the total taxable value of land and additions on the property. | Land | Improvement |
|---|---|---|---|---|
| 2024 | $6,477 | $14,635 | $5,760 | $8,875 |
| 2023 | $6,486 | $14,635 | $5,760 | $8,875 |
| 2022 | $6,182 | $14,635 | $5,760 | $8,875 |
| 2021 | -- | $14,635 | $5,760 | $8,875 |
| 2020 | $3,227 | $7,797 | $0 | $0 |
| 2019 | $2,877 | $6,780 | $0 | $0 |
| 2018 | $2,835 | $6,780 | $0 | $0 |
| 2017 | $3,512 | $8,700 | $0 | $0 |
| 2016 | $3,443 | $8,700 | $0 | $0 |
| 2014 | $3,426 | $8,700 | $2,880 | $5,820 |
| 2013 | $3,426 | $9,030 | $3,600 | $5,430 |
Source: Public Records
Map
Nearby Homes
- 1118 Sanders St
- 536 Glenn St
- 213 Bynum Ave
- 1024 Westover Cir
- 208 Columbia Ave
- 226 Columbia Ave
- 842 S Cherry Rd
- 851 Gist Rd
- 1441 Spring View Ct
- 861 Carey Dr
- 123 Pursley St
- 333 Friendship Dr
- 122 Wylie St
- 1269 Longview Rd
- 1112 Constitution Park Blvd
- 1128 Constitution Park Blvd
- 274 Hancock Union Ln
- 412 Allen St
- 1176 Constitution Park Blvd
- 235 Florence St
- 436 Cherry Rd S
- 1008 Calhoun St
- 426 S Cherry Rd
- 422 S Cherry Rd
- 455 Bynum Ave
- 447 Bynum Ave
- 443 Bynum Ave
- 1027 Calhoun St
- 439 Bynum Ave
- 435 Bynum Ave
- 427 Bynum Ave
- 509 Bynum Ave
- 436 Bynum Ave
- 436 Bynum Ave Unit 43 & 45
- 1101 Calhoun St
- 450 Bynum Ave
- 1105 Smith St
- 1105 Calhoun St
- 1113 Smith St
- 357 Bynum Ave