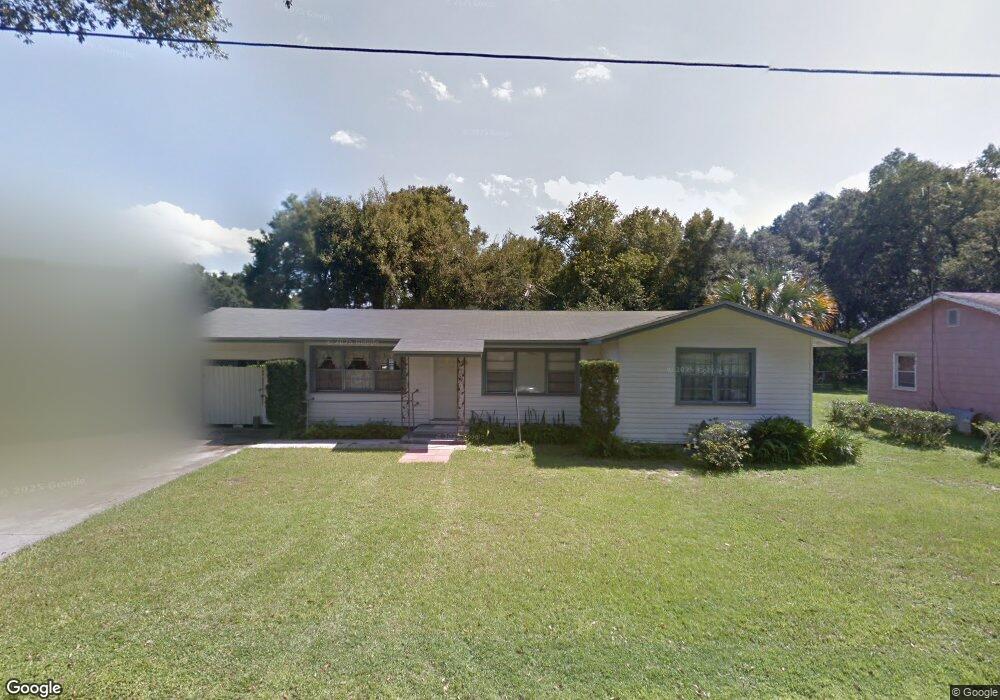
436 E Bennett Ave Deland, FL 32724
North DeLand NeighborhoodEstimated Value: $204,089 - $236,000
2
Beds
1
Bath
1,757
Sq Ft
$125/Sq Ft
Est. Value
About This Home
This home is located at 436 E Bennett Ave, Deland, FL 32724 and is currently estimated at $219,772, approximately $125 per square foot. 436 E Bennett Ave is a home located in Volusia County with nearby schools including George W. Marks Elementary School, Deland High School, and Deland Middle School.
Ownership History
Date
Name
Owned For
Owner Type
Purchase Details
Closed on
Dec 4, 2013
Sold by
Moon Benjamin C
Bought by
Moon Melvin and Moon Ruth Ann
Current Estimated Value
Purchase Details
Closed on
Apr 29, 2013
Sold by
Moon Benjamin C and Moon Jesse
Bought by
Moon Benjamin C
Purchase Details
Closed on
Apr 15, 1987
Bought by
Moon Melvin E and Moon Ruth Ann
Purchase Details
Closed on
Sep 15, 1970
Bought by
Moon Melvin E and Moon Ruth Ann
Create a Home Valuation Report for This Property
The Home Valuation Report is an in-depth analysis detailing your home's value as well as a comparison with similar homes in the area
Home Values in the Area
Average Home Value in this Area
Purchase History
| Date | Buyer | Sale Price | Title Company |
|---|---|---|---|
| Moon Melvin | -- | None Available | |
| Moon Benjamin C | -- | None Available | |
| Moon Melvin E | $100 | -- | |
| Moon Melvin E | $9,500 | -- |
Source: Public Records
Tax History
| Year | Tax Paid | Tax Assessment Tax Assessment Total Assessment is a certain percentage of the fair market value that is determined by local assessors to be the total taxable value of land and additions on the property. | Land | Improvement |
|---|---|---|---|---|
| 2026 | $3,147 | $158,602 | $41,475 | $117,127 |
| 2025 | $3,147 | $158,602 | $41,475 | $117,127 |
| 2024 | $2,223 | $162,371 | $41,475 | $120,896 |
| 2023 | $2,223 | $141,193 | $34,010 | $107,183 |
| 2022 | $2,082 | $130,976 | $34,010 | $96,966 |
| 2021 | $2,018 | $114,183 | $23,641 | $90,542 |
| 2020 | $1,860 | $102,748 | $20,738 | $82,010 |
| 2019 | $1,784 | $89,292 | $16,748 | $72,544 |
| 2018 | $1,664 | $80,012 | $10,886 | $69,126 |
| 2017 | $1,549 | $70,764 | $10,839 | $59,925 |
| 2016 | $1,373 | $60,455 | $0 | $0 |
| 2015 | $1,253 | $47,828 | $0 | $0 |
| 2014 | $1,129 | $38,989 | $0 | $0 |
Source: Public Records
Map
Nearby Homes
- 1412 N Garfield Ave
- 516 Grace Ave
- 1301 N Amelia Ave
- 1207 N Amelia Ave
- 576 E International Speedway Blvd
- 1 Smith Ct
- 205 E Kentucky Ave
- 106 E Rosehill Ave
- 1307 Cook St
- 143 E South St
- 104 E Rosehill Ave
- 1435 Hensley Dr
- 1367 Hensley Dr
- 0 North St Unit 1211817
- 0 North St Unit 1216611
- 0 No Street Name Unit MFRNS1087484
- 0 No St Unit MFRV4933386
- 0 No St Unit MFRO6357154
- 0 No St Unit MFRV4941771
- 0 No St Unit 1121839
- 420 E Bennett Ave
- 410 E Bennett Ave
- 441 E Bennett Ave
- 439 E Bennett Ave
- 443 E Bennett Ave
- 439 Palm Terrace
- 408 E Bennett Ave
- 445 E Bennett Ave
- 459 Palm Terrace
- 406 E Bennett Ave
- 402 E Rosehill Ave
- 406 E Rosehill Ave
- 440 Palm Terrace
- 410 E Rosehill Ave
- 465 Palm Terrace
- 451 E Bennett Ave
- 442 Palm Terrace
- 414 E Rosehill Ave
- 460 Palm Terrace
- 1430 N Garfield Ave
Your Personal Tour Guide
Ask me questions while you tour the home.