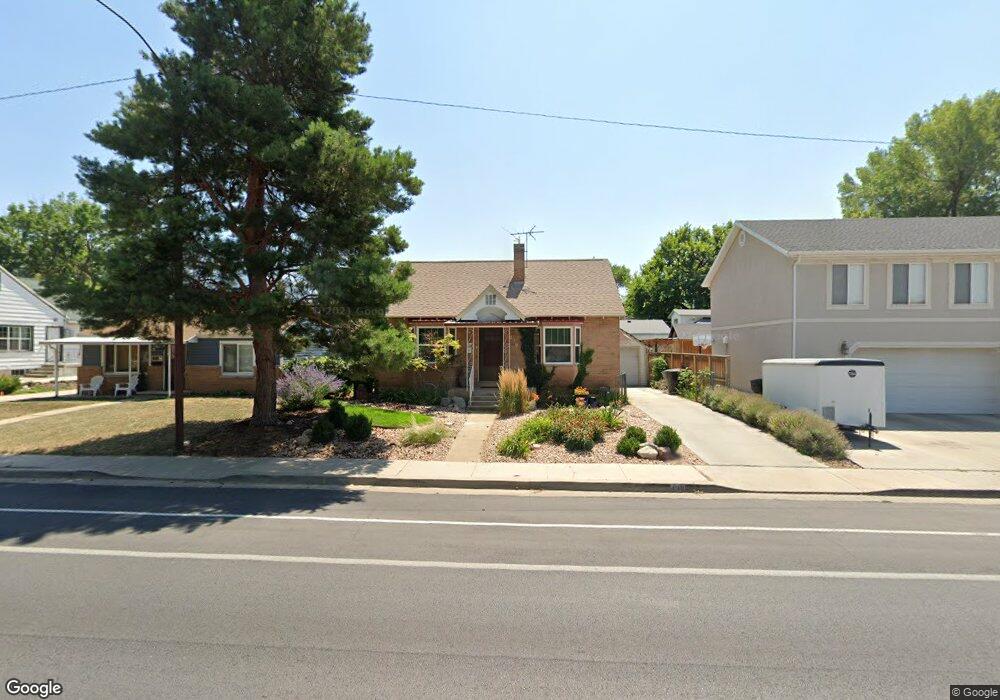
436 E Center St Springville, UT 84663
Estimated Value: $391,000 - $414,000
2
Beds
2
Baths
854
Sq Ft
$469/Sq Ft
Est. Value
About This Home
This home is located at 436 E Center St, Springville, UT 84663 and is currently estimated at $400,811, approximately $469 per square foot. 436 E Center St is a home located in Utah County with nearby schools including Brookside School, Springville Junior High School, and Springville High School.
Ownership History
Date
Name
Owned For
Owner Type
Purchase Details
Closed on
Feb 28, 2019
Sold by
Evjen Thor O and Evjen Kathleen G
Bought by
Evjen Thor O and Evjen Kathleen G
Current Estimated Value
Purchase Details
Closed on
Nov 1, 1996
Sold by
Christensen Brian Dean and Christensen Rita A
Bought by
Evjen Thor O and Evjen Kathleen G
Home Financials for this Owner
Home Financials are based on the most recent Mortgage that was taken out on this home.
Original Mortgage
$72,000
Outstanding Balance
$6,428
Interest Rate
7.01%
Mortgage Type
VA
Estimated Equity
$394,383
Create a Home Valuation Report for This Property
The Home Valuation Report is an in-depth analysis detailing your home's value as well as a comparison with similar homes in the area
Home Values in the Area
Average Home Value in this Area
Purchase History
| Date | Buyer | Sale Price | Title Company |
|---|---|---|---|
| Evjen Thor O | -- | Provo Land Title Co | |
| Evjen Thor O | -- | -- |
Source: Public Records
Mortgage History
| Date | Status | Borrower | Loan Amount |
|---|---|---|---|
| Open | Evjen Thor O | $72,000 |
Source: Public Records
Tax History
| Year | Tax Paid | Tax Assessment Tax Assessment Total Assessment is a certain percentage of the fair market value that is determined by local assessors to be the total taxable value of land and additions on the property. | Land | Improvement |
|---|---|---|---|---|
| 2025 | $1,953 | $210,760 | -- | -- |
| 2024 | $1,953 | $200,035 | $0 | $0 |
| 2023 | $1,922 | $197,065 | $0 | $0 |
| 2022 | $1,820 | $183,260 | $0 | $0 |
| 2021 | $1,611 | $252,500 | $97,600 | $154,900 |
| 2020 | $1,446 | $219,700 | $72,300 | $147,400 |
| 2019 | $1,306 | $202,100 | $60,300 | $141,800 |
| 2018 | $1,215 | $179,300 | $56,000 | $123,300 |
| 2017 | $1,103 | $86,460 | $0 | $0 |
| 2016 | $940 | $72,270 | $0 | $0 |
| 2015 | $878 | $68,970 | $0 | $0 |
| 2014 | $883 | $68,970 | $0 | $0 |
Source: Public Records
Map
Nearby Homes
Your Personal Tour Guide
Ask me questions while you tour the home.