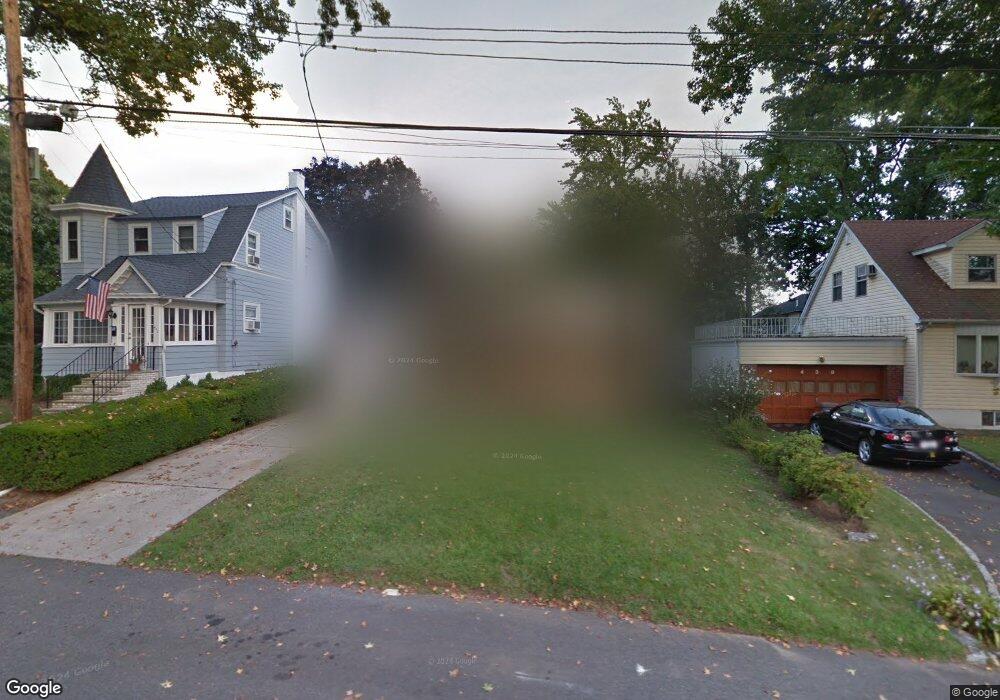
436 Flint St Staten Island, NY 10306
Oakwood NeighborhoodEstimated Value: $933,618 - $1,082,000
--
Bed
4
Baths
2,348
Sq Ft
$421/Sq Ft
Est. Value
About This Home
This home is located at 436 Flint St, Staten Island, NY 10306 and is currently estimated at $989,539, approximately $421 per square foot. 436 Flint St is a home located in Richmond County with nearby schools including P.S. 50 Frank Hankinson School, Myra S. Barnes Intermediate School 24, and New Dorp High School.
Ownership History
Date
Name
Owned For
Owner Type
Purchase Details
Closed on
Nov 24, 2020
Sold by
Hcylton Daniel
Bought by
Holton Daniel and Holton Jessica
Current Estimated Value
Home Financials for this Owner
Home Financials are based on the most recent Mortgage that was taken out on this home.
Original Mortgage
$340,000
Interest Rate
2.67%
Mortgage Type
New Conventional
Purchase Details
Closed on
Nov 22, 2011
Sold by
Smyth Bridget and Smyth Peter F
Bought by
Holton Daniel
Home Financials for this Owner
Home Financials are based on the most recent Mortgage that was taken out on this home.
Original Mortgage
$252,000
Interest Rate
4.1%
Mortgage Type
Purchase Money Mortgage
Create a Home Valuation Report for This Property
The Home Valuation Report is an in-depth analysis detailing your home's value as well as a comparison with similar homes in the area
Home Values in the Area
Average Home Value in this Area
Purchase History
| Date | Buyer | Sale Price | Title Company |
|---|---|---|---|
| Holton Daniel | -- | Real Abstract Ltd | |
| Holton Daniel | $315,000 | Old Republic National Title |
Source: Public Records
Mortgage History
| Date | Status | Borrower | Loan Amount |
|---|---|---|---|
| Previous Owner | Holton Daniel | $340,000 | |
| Previous Owner | Holton Daniel | $252,000 |
Source: Public Records
Tax History Compared to Growth
Tax History
| Year | Tax Paid | Tax Assessment Tax Assessment Total Assessment is a certain percentage of the fair market value that is determined by local assessors to be the total taxable value of land and additions on the property. | Land | Improvement |
|---|---|---|---|---|
| 2025 | $10,239 | $77,580 | $6,229 | $71,351 |
| 2024 | $10,239 | $67,020 | $7,211 | $59,809 |
| 2023 | $10,314 | $50,785 | $6,977 | $43,808 |
| 2022 | $9,850 | $56,100 | $9,480 | $46,620 |
| 2021 | $4,786 | $33,960 | $9,480 | $24,480 |
| 2020 | $4,542 | $33,060 | $9,480 | $23,580 |
| 2019 | $4,488 | $35,880 | $9,480 | $26,400 |
| 2018 | $4,341 | $21,294 | $4,970 | $16,324 |
| 2017 | $4,095 | $20,089 | $6,335 | $13,754 |
| 2016 | $3,789 | $18,952 | $7,449 | $11,503 |
| 2015 | $3,431 | $17,880 | $7,920 | $9,960 |
| 2014 | $3,431 | $17,880 | $7,920 | $9,960 |
Source: Public Records
Map
Nearby Homes