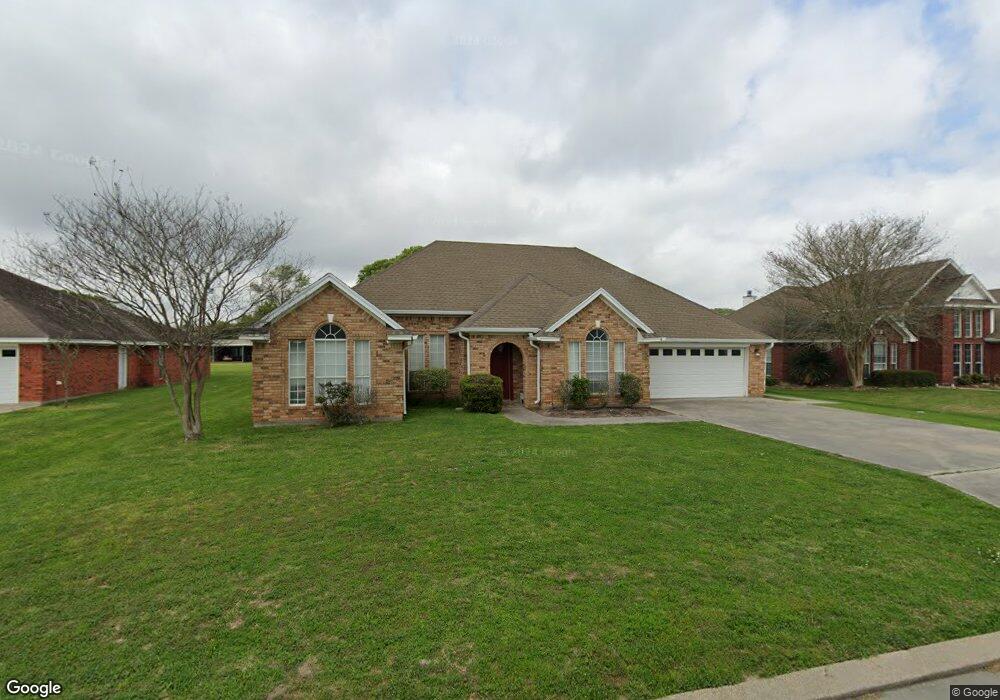
436 Knox Ln Unit AGENT BONUS Bridge City, TX 77611
East Orange NeighborhoodEstimated Value: $299,000 - $325,000
--
Bed
2
Baths
2,365
Sq Ft
$134/Sq Ft
Est. Value
About This Home
This home is located at 436 Knox Ln Unit AGENT BONUS, Bridge City, TX 77611 and is currently estimated at $316,981, approximately $134 per square foot. 436 Knox Ln Unit AGENT BONUS is a home located in Orange County with nearby schools including Bridge City Elementary School, Bridge City Intermediate School, and Bridge City Middle School.
Ownership History
Date
Name
Owned For
Owner Type
Purchase Details
Closed on
Jul 16, 2024
Sold by
Robertson Joseph and Robertson Shelby
Bought by
Mauldin James and Mauldin Haley
Current Estimated Value
Home Financials for this Owner
Home Financials are based on the most recent Mortgage that was taken out on this home.
Original Mortgage
$310,276
Outstanding Balance
$306,570
Interest Rate
6.99%
Mortgage Type
FHA
Estimated Equity
$10,411
Purchase Details
Closed on
Sep 19, 2014
Sold by
Schab Lisa G and Schab Howard
Bought by
Robertson Joseph
Home Financials for this Owner
Home Financials are based on the most recent Mortgage that was taken out on this home.
Original Mortgage
$100,000
Interest Rate
4.18%
Mortgage Type
New Conventional
Purchase Details
Closed on
Aug 17, 2009
Sold by
Dismukes Daniel K and Dismukes Faye D
Bought by
Schab Lisa G
Home Financials for this Owner
Home Financials are based on the most recent Mortgage that was taken out on this home.
Original Mortgage
$70,000
Interest Rate
5.19%
Mortgage Type
Seller Take Back
Purchase Details
Closed on
Jul 29, 1994
Sold by
Unknown Seller
Bought by
Robertson Joseph
Create a Home Valuation Report for This Property
The Home Valuation Report is an in-depth analysis detailing your home's value as well as a comparison with similar homes in the area
Home Values in the Area
Average Home Value in this Area
Purchase History
| Date | Buyer | Sale Price | Title Company |
|---|---|---|---|
| Mauldin James | -- | Capital Title | |
| Robertson Joseph | -- | Stc | |
| Schab Lisa G | -- | None Available | |
| Robertson Joseph | -- | -- | |
| Robertson Joseph | -- | -- |
Source: Public Records
Mortgage History
| Date | Status | Borrower | Loan Amount |
|---|---|---|---|
| Open | Mauldin James | $310,276 | |
| Previous Owner | Robertson Joseph | $100,000 | |
| Previous Owner | Robertson Joseph | $70,000 |
Source: Public Records
Tax History Compared to Growth
Tax History
| Year | Tax Paid | Tax Assessment Tax Assessment Total Assessment is a certain percentage of the fair market value that is determined by local assessors to be the total taxable value of land and additions on the property. | Land | Improvement |
|---|---|---|---|---|
| 2024 | $7,383 | $340,658 | $13,275 | $327,383 |
| 2023 | $6,801 | $317,126 | $13,275 | $303,851 |
| 2022 | $5,311 | $282,115 | $13,275 | $268,840 |
| 2021 | $5,943 | $250,509 | $13,275 | $246,850 |
| 2020 | $5,543 | $227,735 | $13,275 | $214,460 |
| 2019 | $5,408 | $216,484 | $13,275 | $203,209 |
| 2018 | $5,074 | $207,044 | $13,275 | $193,769 |
| 2017 | $4,292 | $207,044 | $13,275 | $193,769 |
| 2016 | $4,760 | $193,284 | $13,275 | $180,009 |
| 2015 | $3,829 | $188,598 | $13,275 | $175,323 |
| 2014 | $3,829 | $192,747 | $13,275 | $179,472 |
Source: Public Records
Map
Nearby Homes
- 252 Cherry Ln
- 515 Romero St
- 535 Romero St
- 2335 Beverly St
- 10 Parkland St
- 2345 Beverly St
- 285 E Darby St
- 425 Jones St
- 275 Nevils St
- 197 Osborne Dr
- 200 Lamesa Dr
- 140 Dupuis St
- 416 Nancy Dr
- 414 David St
- 160 E Darby St
- 255 Blueberry St
- 0000 E Roundbunch Rd
- 245 E Clover Dr
- 245 N Clover St
- 1205 Bourbon St
- 436 Knox Ln
- 436 Knox Ln Unit $5000 in concessions
- 436 Knox Ln Unit 5K AGENT BONUS
- 418 Knox Ln
- 454 Knox Ln
- 400 Knox Ln
- 239 Cherry Ln
- 435 Knox Ln
- 417 Knox Ln
- 472 Knox Ln
- 247 Cherry Ln
- 245 Cherry Ln
- 235 Cherry Ln
- 520 Osborne Dr
- 249 Cherry Ln
- 231 Cherry Ln
- 505 Osborne Dr
- 255 Cherry Ln
- 485 Osborne Dr
- 240 Cherry Ln