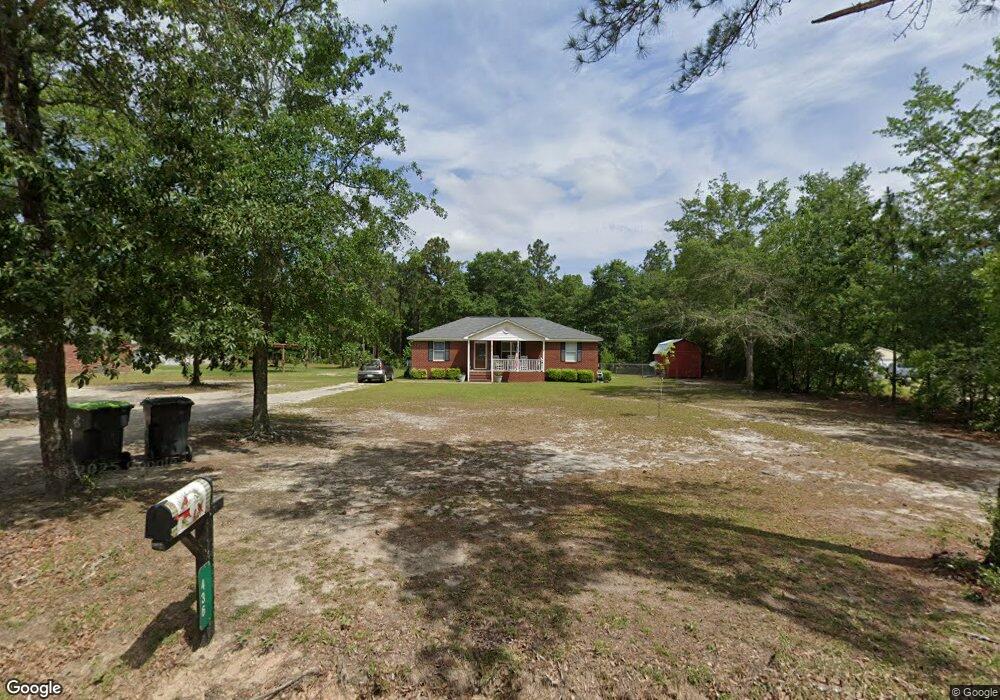
436 Long Branch Rd Gilbert, SC 29054
Estimated Value: $236,211 - $283,000
3
Beds
2
Baths
1,269
Sq Ft
$207/Sq Ft
Est. Value
About This Home
This home is located at 436 Long Branch Rd, Gilbert, SC 29054 and is currently estimated at $262,553, approximately $206 per square foot. 436 Long Branch Rd is a home located in Lexington County with nearby schools including Rocky Creek Elementary School, Beechwood Middle School, and Lexington High School.
Ownership History
Date
Name
Owned For
Owner Type
Purchase Details
Closed on
Jan 21, 2016
Sold by
Crowe Rachel M
Bought by
Butler Ashley C
Current Estimated Value
Home Financials for this Owner
Home Financials are based on the most recent Mortgage that was taken out on this home.
Original Mortgage
$131,500
Outstanding Balance
$104,653
Interest Rate
3.98%
Mortgage Type
New Conventional
Estimated Equity
$157,900
Purchase Details
Closed on
Nov 13, 2013
Sold by
Smith Amanda L
Bought by
Crowe Rachel M
Home Financials for this Owner
Home Financials are based on the most recent Mortgage that was taken out on this home.
Original Mortgage
$121,428
Interest Rate
4.31%
Mortgage Type
Future Advance Clause Open End Mortgage
Purchase Details
Closed on
May 1, 2006
Sold by
Martin Bryan A
Bought by
Smith Amanda L
Home Financials for this Owner
Home Financials are based on the most recent Mortgage that was taken out on this home.
Original Mortgage
$4,000
Interest Rate
6.33%
Mortgage Type
Stand Alone Second
Create a Home Valuation Report for This Property
The Home Valuation Report is an in-depth analysis detailing your home's value as well as a comparison with similar homes in the area
Home Values in the Area
Average Home Value in this Area
Purchase History
| Date | Buyer | Sale Price | Title Company |
|---|---|---|---|
| Butler Ashley C | $131,500 | None Available | |
| Crowe Rachel M | $119,000 | -- | |
| Smith Amanda L | $100,000 | None Available |
Source: Public Records
Mortgage History
| Date | Status | Borrower | Loan Amount |
|---|---|---|---|
| Open | Butler Ashley C | $131,500 | |
| Previous Owner | Crowe Rachel M | $121,428 | |
| Previous Owner | Smith Amanda L | $4,000 |
Source: Public Records
Tax History
| Year | Tax Paid | Tax Assessment Tax Assessment Total Assessment is a certain percentage of the fair market value that is determined by local assessors to be the total taxable value of land and additions on the property. | Land | Improvement |
|---|---|---|---|---|
| 2024 | $4,031 | $7,548 | $1,668 | $5,880 |
| 2023 | $3,744 | $5,032 | $1,112 | $3,920 |
| 2022 | $749 | $5,032 | $1,112 | $3,920 |
| 2020 | $768 | $5,032 | $1,112 | $3,920 |
| 2019 | $818 | $5,260 | $944 | $4,316 |
| 2018 | $803 | $5,260 | $944 | $4,316 |
| 2017 | $779 | $7,890 | $1,416 | $6,474 |
| 2016 | $664 | $4,527 | $944 | $3,583 |
| 2014 | $668 | $4,759 | $945 | $3,814 |
| 2013 | -- | $4,050 | $690 | $3,360 |
Source: Public Records
Map
Nearby Homes
- 240 Jeter Rd
- 360 Twisting Rd
- 1064 Calks Ferry Rd
- 505 Lost Branch Rd
- 916 Calks Ferry Rd
- 413 Windy Farm Rd
- 863 Calks Ferry Rd
- 146 Smith Pond Rd
- 412 Hedge Grove Ln
- 903 Gold Ventura Ct
- 322 Drooping Leaf Rd
- 331 Red Globe Trail
- The Hollins Plan at Summer Orchard
- The Garland Plan at Summer Orchard
- The Kershaw Plan at Summer Orchard
- The Yarmouth Plan at Summer Orchard
- The Idlewild Plan at Summer Orchard
- The Tyndall Plan at Summer Orchard
- 620 Blue Ledge Cir
- 163 Summer Orchard Dr
- 430 Long Branch Rd
- 0 Long Branch Rd Unit 357419
- 0 Long Branch Rd Unit 472397
- 370 Long Branch Rd
- 448 Long Branch Rd
- 407 Long Branch Rd
- 432 Long Branch Rd
- 353 Long Branch Rd
- 433 Long Branch Rd
- 502 Long Branch Rd
- 360 Long Branch Rd
- 340 Long Branch Rd
- 345 Long Branch Rd
- 505 Long Branch Rd
- 513 Long Branch Rd
- 350 Long Branch Rd
- 313 Long Branch Rd
- 526 Long Branch Rd
- 525 Long Branch Rd
- 341 Jeter Rd
Your Personal Tour Guide
Ask me questions while you tour the home.