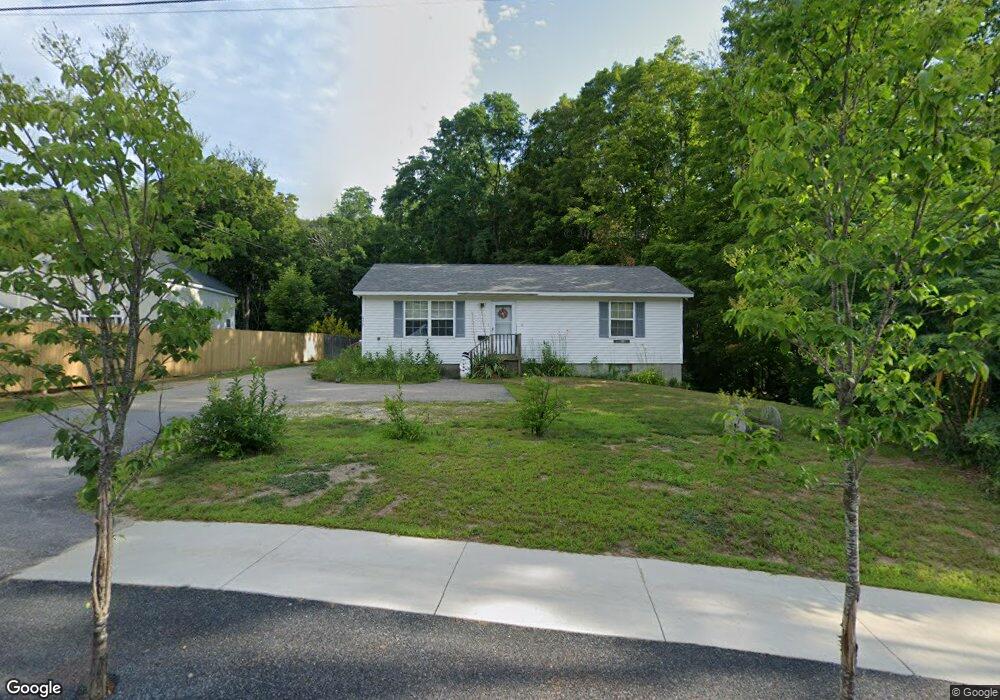
436 Main St Bridgton, ME 04009
Estimated Value: $201,000 - $386,000
--
Bed
--
Bath
--
Sq Ft
0.52
Acres
About This Home
This home is located at 436 Main St, Bridgton, ME 04009 and is currently estimated at $321,892. 436 Main St is a home located in Cumberland County with nearby schools including Lake Region High School and Bridgton Academy.
Ownership History
Date
Name
Owned For
Owner Type
Purchase Details
Closed on
Jun 14, 2013
Sold by
Bardsley Kyle J and Bardsley Thomas M
Bought by
Bardsley Kyle J
Current Estimated Value
Home Financials for this Owner
Home Financials are based on the most recent Mortgage that was taken out on this home.
Original Mortgage
$122,311
Outstanding Balance
$86,616
Interest Rate
3.39%
Mortgage Type
FHA
Estimated Equity
$235,276
Purchase Details
Closed on
Jul 28, 2008
Sold by
Ward Darcy J
Bought by
Bardsley Thomas M and Bardsley Kyle J
Home Financials for this Owner
Home Financials are based on the most recent Mortgage that was taken out on this home.
Original Mortgage
$127,991
Interest Rate
6.35%
Mortgage Type
FHA
Create a Home Valuation Report for This Property
The Home Valuation Report is an in-depth analysis detailing your home's value as well as a comparison with similar homes in the area
Home Values in the Area
Average Home Value in this Area
Purchase History
| Date | Buyer | Sale Price | Title Company |
|---|---|---|---|
| Bardsley Kyle J | -- | -- | |
| Bardsley Thomas M | -- | -- |
Source: Public Records
Mortgage History
| Date | Status | Borrower | Loan Amount |
|---|---|---|---|
| Open | Bardsley Kyle J | $122,311 | |
| Closed | Bardsley Thomas M | $127,991 |
Source: Public Records
Tax History Compared to Growth
Tax History
| Year | Tax Paid | Tax Assessment Tax Assessment Total Assessment is a certain percentage of the fair market value that is determined by local assessors to be the total taxable value of land and additions on the property. | Land | Improvement |
|---|---|---|---|---|
| 2024 | $1,963 | $115,161 | $26,277 | $88,884 |
| 2023 | $1,981 | $115,161 | $26,277 | $88,884 |
| 2022 | $1,750 | $115,161 | $26,277 | $88,884 |
| 2021 | $1,704 | $115,161 | $26,277 | $88,884 |
| 2020 | $1,722 | $115,161 | $26,277 | $88,884 |
| 2019 | $1,727 | $115,161 | $26,277 | $88,884 |
| 2018 | $1,704 | $115,161 | $26,277 | $88,884 |
| 2017 | $1,762 | $115,161 | $26,277 | $88,884 |
| 2016 | $1,710 | $115,161 | $26,277 | $88,884 |
| 2015 | $1,713 | $124,603 | $30,987 | $93,616 |
| 2014 | $1,752 | $124,603 | $30,987 | $93,616 |
Source: Public Records
Map
Nearby Homes
- 6 School St
- 70 Plummers Landing Rd
- 20 Bennett St
- 3 Fowler St
- 7 Memory Ln
- 209 Portland Rd
- 10 Gallinari Way
- 236 Portland Rd Unit A
- 0 Tuttle Ln Unit 1628227
- 220 S High St
- 4 C St
- 27 Stonehedge Dr
- 10 Hebb Dr
- 3 A St
- 26 Middle Ridge Rd
- 34 Middle Ridge Rd
- Lot 23 G Smally Way
- Lot 23 - F Smally Way
- 7 Elysian Way
- Lot 23 - D Smally Way