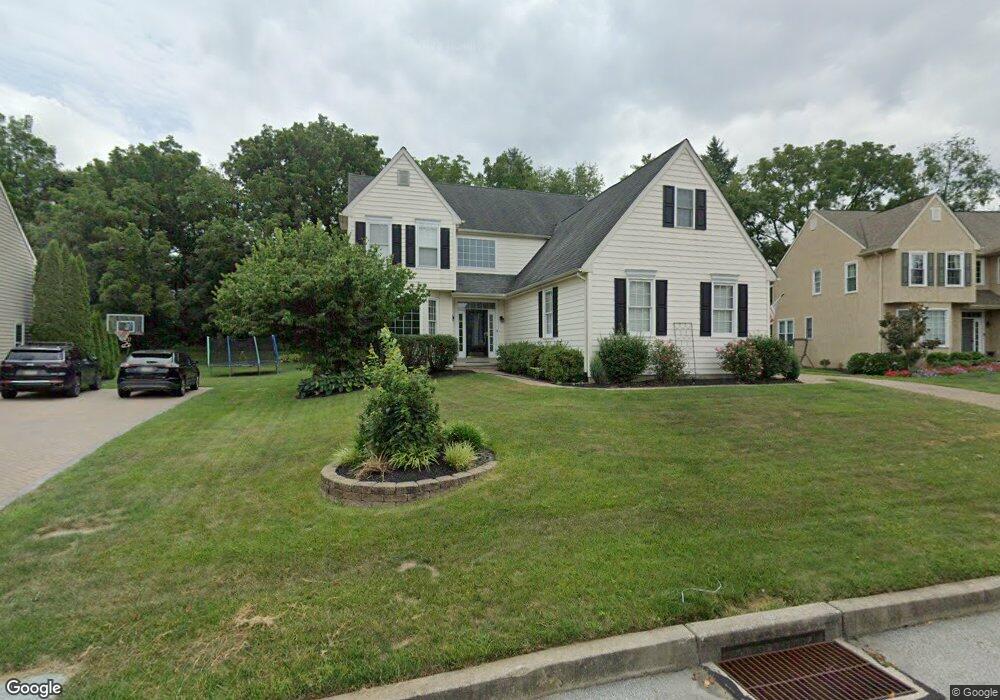
436 Monteray Ln West Chester, PA 19380
Estimated Value: $781,000 - $837,000
4
Beds
3
Baths
2,748
Sq Ft
$296/Sq Ft
Est. Value
About This Home
This home is located at 436 Monteray Ln, West Chester, PA 19380 and is currently estimated at $812,360, approximately $295 per square foot. 436 Monteray Ln is a home located in Chester County with nearby schools including Hillsdale Elementary School, E.N. Peirce Middle School, and Henderson High School.
Ownership History
Date
Name
Owned For
Owner Type
Purchase Details
Closed on
May 29, 2013
Sold by
Laslo Jenifer A and Laslo Brian R
Bought by
Laslo Brian R
Current Estimated Value
Purchase Details
Closed on
Jan 25, 2008
Sold by
Laslo Brian R
Bought by
Laslo Brian R and Laslo Jenifer A
Home Financials for this Owner
Home Financials are based on the most recent Mortgage that was taken out on this home.
Original Mortgage
$404,000
Outstanding Balance
$255,896
Interest Rate
6.14%
Mortgage Type
New Conventional
Estimated Equity
$556,464
Purchase Details
Closed on
Jul 12, 2006
Sold by
Hewson Daniel and Hewson Kerry
Bought by
Laslo Brian R
Home Financials for this Owner
Home Financials are based on the most recent Mortgage that was taken out on this home.
Original Mortgage
$408,000
Interest Rate
6.62%
Mortgage Type
Purchase Money Mortgage
Create a Home Valuation Report for This Property
The Home Valuation Report is an in-depth analysis detailing your home's value as well as a comparison with similar homes in the area
Home Values in the Area
Average Home Value in this Area
Purchase History
| Date | Buyer | Sale Price | Title Company |
|---|---|---|---|
| Laslo Brian R | -- | None Available | |
| Laslo Brian R | -- | None Available | |
| Laslo Brian R | $510,000 | None Available |
Source: Public Records
Mortgage History
| Date | Status | Borrower | Loan Amount |
|---|---|---|---|
| Open | Laslo Brian R | $404,000 | |
| Closed | Laslo Brian R | $408,000 |
Source: Public Records
Tax History Compared to Growth
Tax History
| Year | Tax Paid | Tax Assessment Tax Assessment Total Assessment is a certain percentage of the fair market value that is determined by local assessors to be the total taxable value of land and additions on the property. | Land | Improvement |
|---|---|---|---|---|
| 2025 | $7,541 | $260,160 | $56,230 | $203,930 |
| 2024 | $7,541 | $260,160 | $56,230 | $203,930 |
| 2023 | $7,541 | $260,160 | $56,230 | $203,930 |
| 2022 | $7,444 | $260,160 | $56,230 | $203,930 |
| 2021 | $7,340 | $260,160 | $56,230 | $203,930 |
| 2020 | $7,293 | $260,160 | $56,230 | $203,930 |
| 2019 | $7,191 | $260,160 | $56,230 | $203,930 |
| 2018 | $7,038 | $260,160 | $56,230 | $203,930 |
| 2017 | $6,886 | $260,160 | $56,230 | $203,930 |
| 2016 | $5,808 | $260,160 | $56,230 | $203,930 |
| 2015 | $5,808 | $260,160 | $56,230 | $203,930 |
| 2014 | $5,808 | $260,160 | $56,230 | $203,930 |
Source: Public Records
Map
Nearby Homes
- 751 Mccardle Dr Unit 27
- 744 Mccardle Dr Unit 35
- 505 S Maryland Ave
- 765 Bradford Terrace Unit 238
- 303 Star Tavern Ln
- 324 Star Tavern Ln
- 345 Star Tavern Ln
- 368 Star Tavern Ln
- 806 Downingtown Pike
- 722 Scotch Way Unit C-26
- 303 W Washington St
- 616 W Chestnut St
- 418 Hannum Ave
- 532 N Walnut St
- 525 Raymond Dr Unit 45
- 523 Raymond Dr Unit 46
- 443 W Gay St
- 626 N Matlack St
- 433 W Gay St
- 333 Hannum Ave
- 438 Monteray Ln
- 434 Monteray Ln
- 440 Monteray Ln
- 432 Monteray Ln
- 921 Whiticar Ln
- 920 Whiticar Ln
- 433 Monteray Ln
- 430 Monteray Ln
- 923 Whiticar Ln
- 603 Locust Ln N
- 922 Whiticar Ln
- 431 Monteray Ln
- 428 Monteray Ln
- 925 Whiticar Ln
- 605 Locust Ln N
- 745 Mccardle Dr Unit 19
- 517 Locust Ln N
- 747 Mccardle Dr Unit 25
- 743 Mccardle Dr
- 927 Whiticar Ln