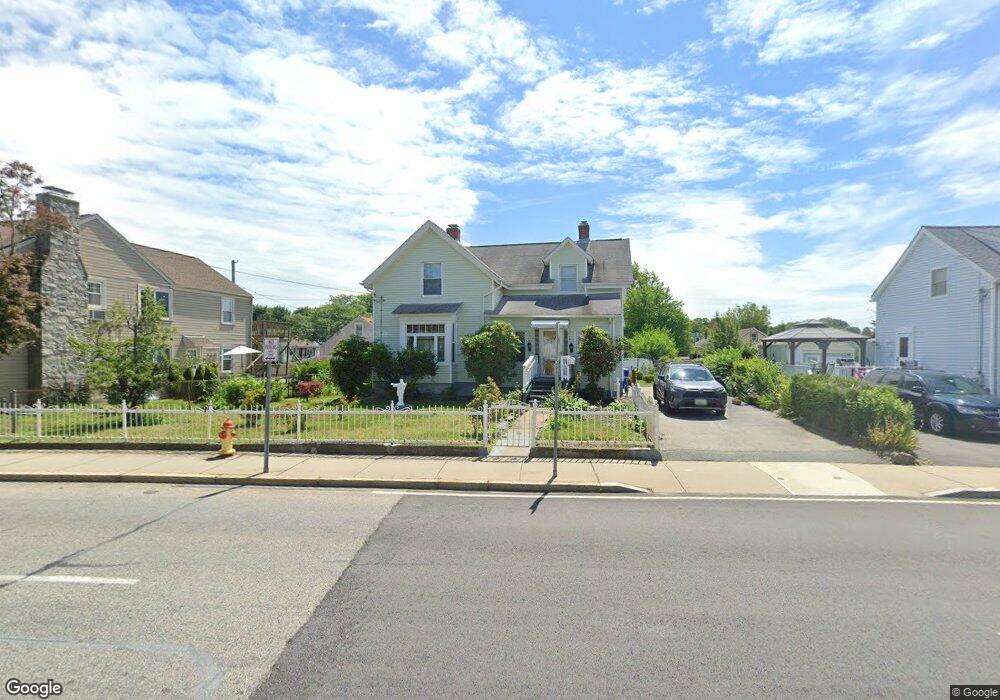
436 N Broadway East Providence, RI 02914
Carpenters Corner NeighborhoodEstimated Value: $338,000 - $435,440
3
Beds
2
Baths
1,344
Sq Ft
$290/Sq Ft
Est. Value
About This Home
This home is located at 436 N Broadway, East Providence, RI 02914 and is currently estimated at $389,860, approximately $290 per square foot. 436 N Broadway is a home located in Providence County with nearby schools including East Providence High School, Ocean State Montessori School, and St Margaret School.
Ownership History
Date
Name
Owned For
Owner Type
Purchase Details
Closed on
Feb 2, 1993
Sold by
Ospina Juan G and Ospina Adriana
Bought by
Ospina Luz A
Current Estimated Value
Home Financials for this Owner
Home Financials are based on the most recent Mortgage that was taken out on this home.
Original Mortgage
$57,000
Interest Rate
8.16%
Mortgage Type
Purchase Money Mortgage
Purchase Details
Closed on
Feb 28, 1990
Sold by
Bailey Vincent B
Bought by
Ospina Juan G
Home Financials for this Owner
Home Financials are based on the most recent Mortgage that was taken out on this home.
Original Mortgage
$50,000
Interest Rate
9.78%
Mortgage Type
Purchase Money Mortgage
Create a Home Valuation Report for This Property
The Home Valuation Report is an in-depth analysis detailing your home's value as well as a comparison with similar homes in the area
Home Values in the Area
Average Home Value in this Area
Purchase History
| Date | Buyer | Sale Price | Title Company |
|---|---|---|---|
| Ospina Luz A | $60,000 | -- | |
| Ospina Juan G | $118,000 | -- |
Source: Public Records
Mortgage History
| Date | Status | Borrower | Loan Amount |
|---|---|---|---|
| Closed | Ospina Juan G | $57,000 | |
| Previous Owner | Ospina Juan G | $50,000 |
Source: Public Records
Tax History Compared to Growth
Tax History
| Year | Tax Paid | Tax Assessment Tax Assessment Total Assessment is a certain percentage of the fair market value that is determined by local assessors to be the total taxable value of land and additions on the property. | Land | Improvement |
|---|---|---|---|---|
| 2024 | $4,912 | $320,400 | $101,900 | $218,500 |
| 2023 | $4,729 | $320,400 | $101,900 | $218,500 |
| 2022 | $4,228 | $193,400 | $47,500 | $145,900 |
| 2021 | $4,158 | $193,400 | $47,500 | $145,900 |
| 2020 | $3,982 | $193,400 | $47,500 | $145,900 |
| 2019 | $3,872 | $193,400 | $47,500 | $145,900 |
| 2018 | $3,764 | $164,500 | $48,200 | $116,300 |
| 2017 | $3,680 | $164,500 | $48,200 | $116,300 |
| 2016 | $3,662 | $164,500 | $48,200 | $116,300 |
| 2015 | $3,355 | $146,200 | $44,700 | $101,500 |
| 2014 | $3,355 | $146,200 | $44,700 | $101,500 |
Source: Public Records
Map
Nearby Homes
- 48 Hobson Ave
- 71 Priscilla Ave
- 41 What Cheer Ave
- 62 Byron Ave
- 169 Wilmarth Ave
- 200 Woodward Ave
- 661 N Broadway
- 674 N Broadway
- 12 Parsons St Unit 14
- 10 Linden Ave
- 115 Sutton Ave
- 73 Massasoit Ave
- 125 Roger Williams Ave
- 168 Waterman Ave
- 58 Central Ave
- 16 Elm Ave
- 0 Newman Ave Rear
- 141 E Point Dr Unit 206
- 141 E Point Dr Unit 108
- 141 E Point Dr Unit 401