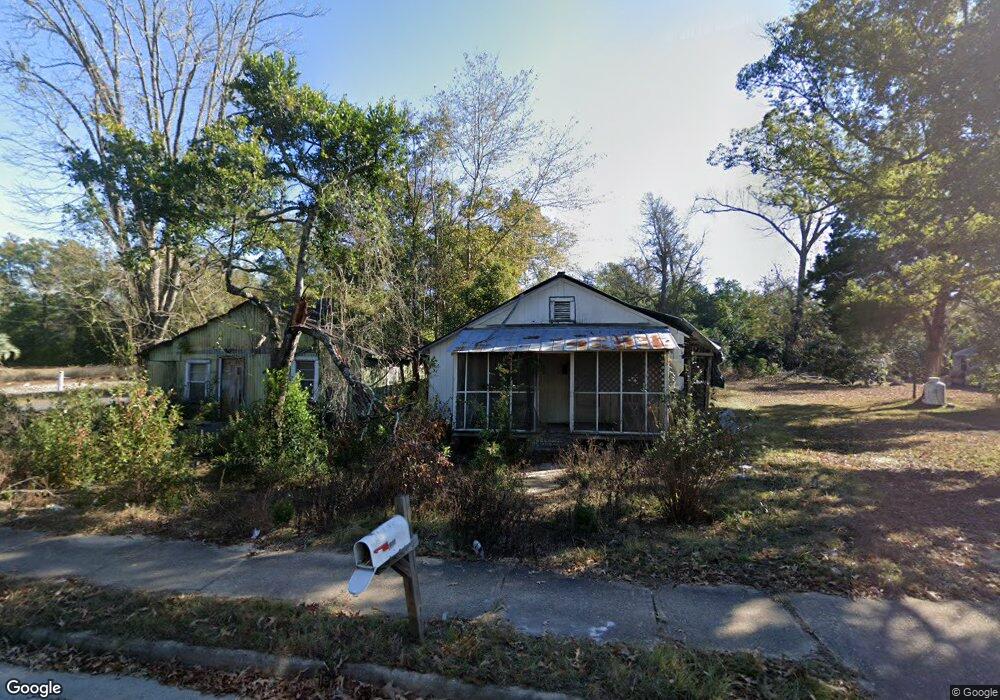
436 N Sims St Bainbridge, GA 39817
Estimated Value: $54,579 - $164,000
2
Beds
1
Bath
728
Sq Ft
$123/Sq Ft
Est. Value
About This Home
This home is located at 436 N Sims St, Bainbridge, GA 39817 and is currently estimated at $89,395, approximately $122 per square foot. 436 N Sims St is a home located in Decatur County with nearby schools including Bainbridge High School and Grace Christian Academy.
Ownership History
Date
Name
Owned For
Owner Type
Purchase Details
Closed on
Oct 2, 2024
Sold by
Green Hattie
Bought by
G & G Asset Holdings Llc
Current Estimated Value
Create a Home Valuation Report for This Property
The Home Valuation Report is an in-depth analysis detailing your home's value as well as a comparison with similar homes in the area
Home Values in the Area
Average Home Value in this Area
Purchase History
| Date | Buyer | Sale Price | Title Company |
|---|---|---|---|
| G & G Asset Holdings Llc | $3,800 | -- |
Source: Public Records
Tax History Compared to Growth
Tax History
| Year | Tax Paid | Tax Assessment Tax Assessment Total Assessment is a certain percentage of the fair market value that is determined by local assessors to be the total taxable value of land and additions on the property. | Land | Improvement |
|---|---|---|---|---|
| 2024 | $178 | $5,632 | $842 | $4,790 |
| 2023 | $174 | $5,632 | $842 | $4,790 |
| 2022 | $174 | $5,632 | $842 | $4,790 |
| 2021 | $104 | $5,052 | $842 | $4,210 |
| 2020 | $89 | $4,412 | $842 | $3,570 |
| 2019 | $86 | $4,232 | $842 | $3,390 |
| 2018 | $85 | $4,232 | $842 | $3,390 |
| 2017 | $153 | $4,384 | $856 | $3,528 |
| 2016 | $94 | $4,384 | $856 | $3,528 |
| 2015 | $97 | $4,384 | $856 | $3,528 |
| 2014 | $91 | $4,384 | $856 | $3,528 |
| 2013 | -- | $4,384 | $856 | $3,528 |
Source: Public Records
Map
Nearby Homes
- 705 N Lamar St
- 1020 E Water St
- 1204 E Water St
- Lot 7 Easy Dr
- 927 5th Ave
- 401 S Sims St
- 1505 E Water St
- 906 E Sharpe St
- 836 Cooper St
- 515 S Spruce St
- 411 Independent St
- 606 Chason St
- 502 Planter St
- 640 E Shotwell St
- 435 E Broughton St
- 632 E Shotwell St
- 1602 Belcher Ln
- 703 S Boulevard Dr
- Dell Rd
- 418 E Broughton St