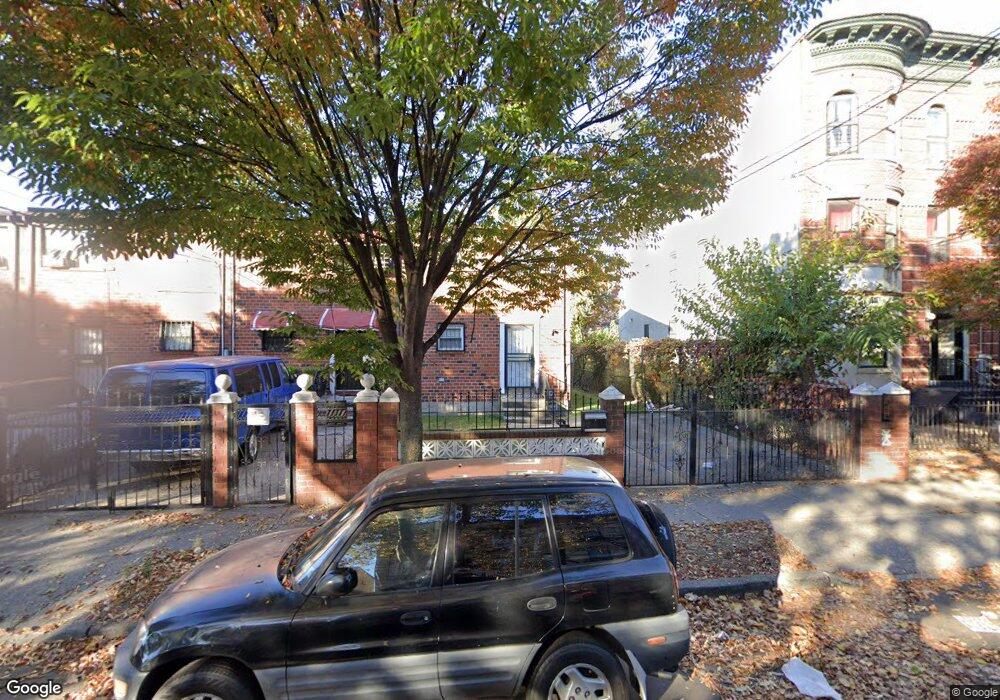
436 New Jersey Ave Brooklyn, NY 11207
East New York NeighborhoodEstimated Value: $591,501 - $730,000
--
Bed
--
Bath
1,134
Sq Ft
$575/Sq Ft
Est. Value
About This Home
This home is located at 436 New Jersey Ave, Brooklyn, NY 11207 and is currently estimated at $651,625, approximately $574 per square foot. 436 New Jersey Ave is a home located in Kings County with nearby schools including P.S. 149 Danny Kaye, J.H.S 292 Margaret S. Douglas, and Achievement First - East New York School.
Ownership History
Date
Name
Owned For
Owner Type
Purchase Details
Closed on
Feb 18, 2014
Sold by
Realty Corporation Of Ny
Bought by
Jones Latonya
Current Estimated Value
Home Financials for this Owner
Home Financials are based on the most recent Mortgage that was taken out on this home.
Original Mortgage
$285,154
Outstanding Balance
$215,912
Interest Rate
4.39%
Mortgage Type
New Conventional
Estimated Equity
$435,713
Purchase Details
Closed on
Jun 14, 2013
Sold by
Phillip Nia
Bought by
Realty Corporation Of Ny
Home Financials for this Owner
Home Financials are based on the most recent Mortgage that was taken out on this home.
Original Mortgage
$225,000
Interest Rate
3.92%
Mortgage Type
New Conventional
Purchase Details
Closed on
May 9, 1991
Sold by
East Bk Church Sponcomm
Bought by
Hinds Dora
Create a Home Valuation Report for This Property
The Home Valuation Report is an in-depth analysis detailing your home's value as well as a comparison with similar homes in the area
Home Values in the Area
Average Home Value in this Area
Purchase History
| Date | Buyer | Sale Price | Title Company |
|---|---|---|---|
| Jones Latonya | $295,000 | -- | |
| Realty Corporation Of Ny | $150,000 | -- | |
| Hinds Dora | -- | -- | |
| Phillip Eclif | -- | -- |
Source: Public Records
Mortgage History
| Date | Status | Borrower | Loan Amount |
|---|---|---|---|
| Open | Jones Latonya | $285,154 | |
| Previous Owner | Realty Corporation Of Ny | $225,000 |
Source: Public Records
Tax History Compared to Growth
Tax History
| Year | Tax Paid | Tax Assessment Tax Assessment Total Assessment is a certain percentage of the fair market value that is determined by local assessors to be the total taxable value of land and additions on the property. | Land | Improvement |
|---|---|---|---|---|
| 2025 | $4,041 | $37,260 | $13,320 | $23,940 |
| 2024 | $4,041 | $36,600 | $13,320 | $23,280 |
| 2023 | $3,839 | $36,600 | $13,320 | $23,280 |
| 2022 | $3,766 | $32,700 | $13,320 | $19,380 |
| 2021 | $3,944 | $25,680 | $13,320 | $12,360 |
| 2020 | $1,840 | $26,400 | $13,320 | $13,080 |
| 2019 | $3,458 | $26,400 | $13,320 | $13,080 |
| 2018 | $3,152 | $16,920 | $7,155 | $9,765 |
| 2017 | $3,149 | $16,920 | $9,558 | $7,362 |
| 2016 | $3,046 | $16,789 | $11,539 | $5,250 |
| 2015 | $1,786 | $15,839 | $8,469 | $7,370 |
| 2014 | $1,786 | $14,943 | $6,792 | $8,151 |
Source: Public Records
Map
Nearby Homes
- 353 Pennsylvania Ave
- 444 New Jersey Ave
- 663 Sutter Ave
- 667 Sutter Ave
- 317 Pennsylvania Ave
- 439 Vermont St
- 637 Blake Ave
- 297 Pennsylvania Ave
- 342 Wyona St
- 486 Vermont St
- 477 Vermont St
- 412 Bradford St
- 34&36 Marginal St
- 459 Belmont Ave
- 440 Miller Ave
- 443 Miller Ave
- 774 Blake Ave
- 402 van Siclen Ave
- 358 van Siclen Ave
- 346 van Siclen Ave
- 438 New Jersey Ave
- 432 New Jersey Ave Unit 6
- 434 New Jersey Ave
- 440 New Jersey Ave
- 430 New Jersey Ave
- 442 New Jersey Ave
- 444 New Jersey Ave Unit Building
- 428 New Jersey Ave
- 446 New Jersey Ave
- 420 New Jersey Ave
- 351 Pennsylvania Ave
- 448 New Jersey Ave
- 355 Pennsylvania Ave Unit COMMERCIAL
- 355 Pennsylvania Ave
- 349 Pennsylvania Ave
- 377 Pennsylvania Ave
- 418 New Jersey Ave Unit BLDG
- 418 New Jersey Ave
- 450 New Jersey Ave
- 347 Pennsylvania Ave