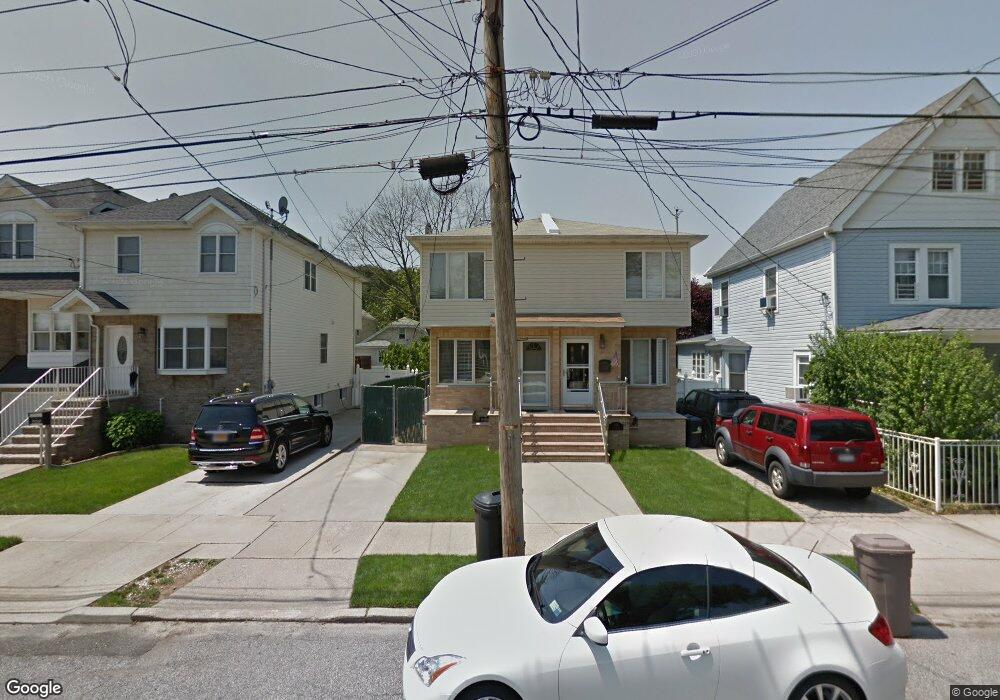
436 Oder Ave Staten Island, NY 10304
Concord NeighborhoodEstimated Value: $662,103 - $777,000
3
Beds
2
Baths
1,040
Sq Ft
$699/Sq Ft
Est. Value
About This Home
This home is located at 436 Oder Ave, Staten Island, NY 10304 and is currently estimated at $726,776, approximately $698 per square foot. 436 Oder Ave is a home located in Richmond County with nearby schools including P.S. 48 - William C. Wilcox, I.S. 49 Berta A Dreyfus, and New Dorp High School.
Ownership History
Date
Name
Owned For
Owner Type
Purchase Details
Closed on
Mar 10, 2003
Sold by
Appel Anton
Bought by
Hamza Ayman M and Hamza Anna
Current Estimated Value
Home Financials for this Owner
Home Financials are based on the most recent Mortgage that was taken out on this home.
Original Mortgage
$259,560
Interest Rate
5.86%
Mortgage Type
Purchase Money Mortgage
Create a Home Valuation Report for This Property
The Home Valuation Report is an in-depth analysis detailing your home's value as well as a comparison with similar homes in the area
Home Values in the Area
Average Home Value in this Area
Purchase History
| Date | Buyer | Sale Price | Title Company |
|---|---|---|---|
| Hamza Ayman M | $288,400 | Custom Title Services Inc |
Source: Public Records
Mortgage History
| Date | Status | Borrower | Loan Amount |
|---|---|---|---|
| Previous Owner | Hamza Ayman M | $259,560 |
Source: Public Records
Tax History
| Year | Tax Paid | Tax Assessment Tax Assessment Total Assessment is a certain percentage of the fair market value that is determined by local assessors to be the total taxable value of land and additions on the property. | Land | Improvement |
|---|---|---|---|---|
| 2025 | $5,307 | $41,100 | $4,951 | $36,149 |
| 2024 | $5,319 | $37,500 | $5,119 | $32,381 |
| 2023 | $5,366 | $27,821 | $4,826 | $22,995 |
| 2022 | $5,094 | $33,600 | $6,900 | $26,700 |
| 2021 | $5,179 | $34,920 | $6,900 | $28,020 |
| 2020 | $4,906 | $30,120 | $6,900 | $23,220 |
| 2019 | $4,557 | $32,700 | $6,900 | $25,800 |
| 2018 | $4,428 | $23,184 | $5,197 | $17,987 |
| 2017 | $4,280 | $22,464 | $5,779 | $16,685 |
| 2016 | $4,030 | $21,707 | $6,059 | $15,648 |
| 2015 | $3,403 | $20,479 | $5,093 | $15,386 |
| 2014 | $3,403 | $19,320 | $5,760 | $13,560 |
Source: Public Records
Map
Nearby Homes
Your Personal Tour Guide
Ask me questions while you tour the home.