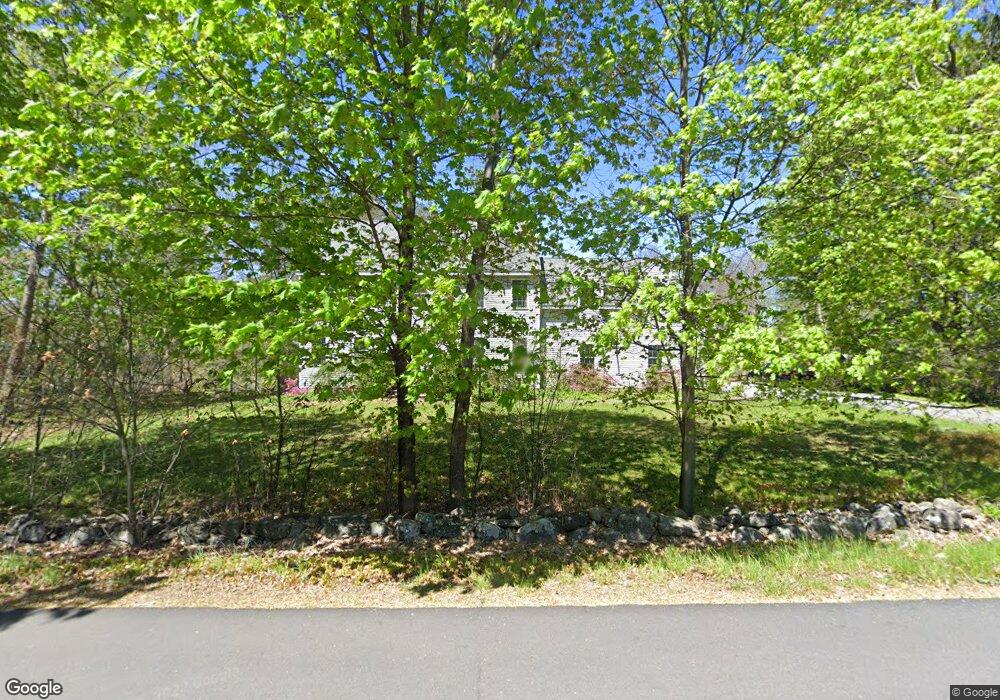
436 Osgood St North Andover, MA 01845
Estimated Value: $982,000 - $1,165,000
4
Beds
3
Baths
3,114
Sq Ft
$349/Sq Ft
Est. Value
About This Home
This home is located at 436 Osgood St, North Andover, MA 01845 and is currently estimated at $1,085,597, approximately $348 per square foot. 436 Osgood St is a home located in Essex County with nearby schools including Kittredge Elementary School, North Andover Middle School, and North Andover High School.
Ownership History
Date
Name
Owned For
Owner Type
Purchase Details
Closed on
Nov 21, 2016
Sold by
Gamble Inga C and Larson Arthur D
Bought by
Larson Arthur D and Larson Martha J
Current Estimated Value
Home Financials for this Owner
Home Financials are based on the most recent Mortgage that was taken out on this home.
Original Mortgage
$369,441
Outstanding Balance
$236,682
Interest Rate
3.42%
Mortgage Type
New Conventional
Estimated Equity
$848,915
Purchase Details
Closed on
Sep 10, 2007
Sold by
Gamble Inga C and Gamble Clive R
Bought by
Gamble Inga C and Larson Arthur D
Home Financials for this Owner
Home Financials are based on the most recent Mortgage that was taken out on this home.
Original Mortgage
$415,000
Interest Rate
6.74%
Mortgage Type
Purchase Money Mortgage
Purchase Details
Closed on
Jan 1, 1973
Bought by
Larson Arthur
Create a Home Valuation Report for This Property
The Home Valuation Report is an in-depth analysis detailing your home's value as well as a comparison with similar homes in the area
Home Values in the Area
Average Home Value in this Area
Purchase History
| Date | Buyer | Sale Price | Title Company |
|---|---|---|---|
| Larson Arthur D | -- | -- | |
| Gamble Inga C | -- | -- | |
| Larson Arthur | -- | -- |
Source: Public Records
Mortgage History
| Date | Status | Borrower | Loan Amount |
|---|---|---|---|
| Open | Larson Arthur D | $369,441 | |
| Previous Owner | Larson Arthur | $405,000 | |
| Previous Owner | Gamble Inga C | $415,000 |
Source: Public Records
Tax History Compared to Growth
Tax History
| Year | Tax Paid | Tax Assessment Tax Assessment Total Assessment is a certain percentage of the fair market value that is determined by local assessors to be the total taxable value of land and additions on the property. | Land | Improvement |
|---|---|---|---|---|
| 2025 | $10,636 | $944,600 | $420,900 | $523,700 |
| 2024 | $10,122 | $912,700 | $399,100 | $513,600 |
| 2023 | $9,679 | $790,800 | $337,000 | $453,800 |
| 2022 | $9,253 | $683,900 | $293,400 | $390,500 |
| 2021 | $8,892 | $627,500 | $267,300 | $360,200 |
| 2020 | $8,531 | $620,900 | $260,700 | $360,200 |
| 2019 | $8,326 | $620,900 | $260,700 | $360,200 |
| 2018 | $9,022 | $620,900 | $260,700 | $360,200 |
| 2017 | $9,449 | $661,700 | $228,800 | $432,900 |
| 2016 | $8,949 | $627,100 | $231,000 | $396,100 |
| 2015 | $8,876 | $616,800 | $217,600 | $399,200 |
Source: Public Records
Map
Nearby Homes
- 84 Mill Pond Unit 84
- 84 Mill Pond
- 98 Mill Pond
- 16 Court St
- 112 Mill Pond
- 64 E Water St
- 116 Mill Pond
- 5 Walker Rd Unit 3
- 12 Walker Rd Unit 6
- 372-374 Main St
- 24 Faulkner Rd
- 33 Upland St
- 125 Phillips Brooks Rd
- 15 Furber Ave
- 33 Pilgrim St
- 19 Fernview Ave Unit 6
- 148 Main St Unit O102
- 148 Main St Unit F444
- 148 Main St Unit S327
- 29 Brightwood Ave
- 400 Osgood St
- 460 Osgood St
- 440 Osgood St
- 10-12 Harkaway Rd
- 10 Harkaway Rd
- 16 Harkaway Rd
- 18 Harkaway Rd Unit 2
- 18 Harkaway Rd
- 18 Harkaway Rd Unit 18
- 486 Osgood St
- 22 Harkaway Rd
- 20 Harkaway Rd
- 26 Harkaway Rd
- 9 Mill Pond
- 498 Osgood St
- 10 Mill Pond
- 10 Mill Pond Unit 10
- 10 Mill Pond Unit 10
- 10 Mill Pond
- 10 Mill Pond Unit 4