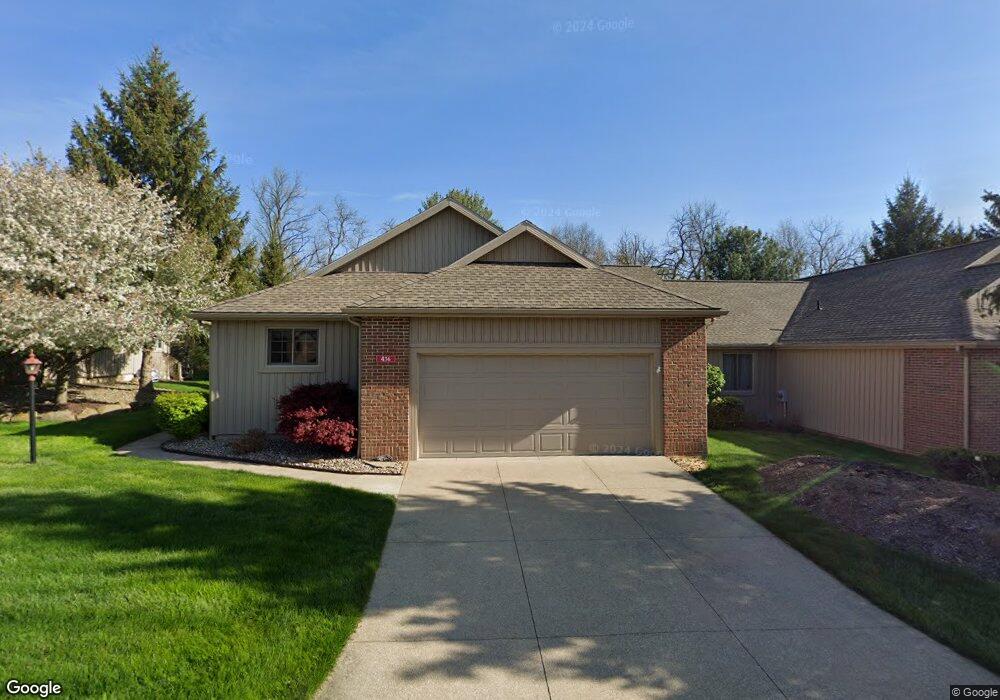
436 Paul Tell Trail Unit 123 Tallmadge, OH 44278
Estimated Value: $267,000 - $283,000
2
Beds
2
Baths
1,484
Sq Ft
$183/Sq Ft
Est. Value
About This Home
This home is located at 436 Paul Tell Trail Unit 123, Tallmadge, OH 44278 and is currently estimated at $272,143, approximately $183 per square foot. 436 Paul Tell Trail Unit 123 is a home located in Summit County with nearby schools including Tallmadge Middle School, Tallmadge High School, and Middlebury Academy.
Ownership History
Date
Name
Owned For
Owner Type
Purchase Details
Closed on
Apr 22, 2025
Sold by
Knight Bruce D and Knight Laura K
Bought by
Bruce D Knight And Laura K Knight Revocable T and Knight
Current Estimated Value
Purchase Details
Closed on
Jul 2, 2019
Sold by
Livi Schiele Robin K
Bought by
Knight Bruce D and Knight Laura K
Home Financials for this Owner
Home Financials are based on the most recent Mortgage that was taken out on this home.
Original Mortgage
$142,500
Interest Rate
4%
Mortgage Type
New Conventional
Purchase Details
Closed on
May 31, 2006
Sold by
Dickey Edward D and Dickey Judith E
Bought by
Kramer Jacqueline and The Jacqueline Nagy Revocable Living Tr
Purchase Details
Closed on
Apr 21, 2003
Sold by
Robin Ridge Development Co
Bought by
Dickey Edward D and Dickey Judith E
Create a Home Valuation Report for This Property
The Home Valuation Report is an in-depth analysis detailing your home's value as well as a comparison with similar homes in the area
Home Values in the Area
Average Home Value in this Area
Purchase History
| Date | Buyer | Sale Price | Title Company |
|---|---|---|---|
| Bruce D Knight And Laura K Knight Revocable T | -- | None Listed On Document | |
| Knight Bruce D | $190,000 | Fireland Title | |
| Kramer Jacqueline | $187,900 | Bond | |
| Dickey Edward D | $175,900 | Land America/Lawyers Title |
Source: Public Records
Mortgage History
| Date | Status | Borrower | Loan Amount |
|---|---|---|---|
| Previous Owner | Knight Bruce D | $142,500 |
Source: Public Records
Tax History Compared to Growth
Tax History
| Year | Tax Paid | Tax Assessment Tax Assessment Total Assessment is a certain percentage of the fair market value that is determined by local assessors to be the total taxable value of land and additions on the property. | Land | Improvement |
|---|---|---|---|---|
| 2025 | $3,866 | $77,519 | $8,180 | $69,339 |
| 2024 | $3,866 | $77,519 | $8,180 | $69,339 |
| 2023 | $3,866 | $77,519 | $8,180 | $69,339 |
| 2022 | $3,386 | $55,489 | $5,845 | $49,644 |
| 2021 | $3,401 | $55,489 | $5,845 | $49,644 |
| 2020 | $3,374 | $55,490 | $5,850 | $49,640 |
| 2019 | $2,760 | $49,320 | $5,730 | $43,590 |
| 2018 | $2,431 | $49,320 | $5,900 | $43,420 |
| 2017 | $2,152 | $49,320 | $5,900 | $43,420 |
| 2016 | $2,322 | $44,360 | $5,900 | $38,460 |
| 2015 | $2,152 | $44,360 | $5,900 | $38,460 |
| 2014 | $2,138 | $44,360 | $5,900 | $38,460 |
| 2013 | $2,531 | $51,680 | $5,900 | $45,780 |
Source: Public Records
Map
Nearby Homes
- 500 Dottie Ct Unit 109
- 130 Strecker Dr
- 2333 Eastwood Ave
- 2330 Eastwood Ave
- 353 Southeast Ave
- 464 Carruthers Rd
- 331 Southeast Ave
- 2354 Savoy Ave
- 689 Alaho St
- 77 Northwood Ln
- 572 Eastglen Cir
- 75 Glenwood Cir
- 261 van Evera Rd
- 505 Moody St
- 2253 Tyro Ave
- 213 Green Hill Dr
- 685 Beechview Dr
- 469 Lodi St
- 758 Humble Rd
- 786 Southeast Ave
- 432 Paul Tell Trail Unit 122
- 442 Paul Tell Trail Unit 124
- 446 Paul Tell Trail Unit 125
- 435 Paul Tell Trail Unit 119
- 439 Paul Tell Trail Unit 118
- 450 Paul Tell Trail Unit 126
- 443 Paul Tell Trail Unit 117
- 449 Paul Tell Trail Unit 116
- 473 Treasure Ln Unit 121
- 477 Treasure Ln Unit 120
- 472 Dottie Ct Unit 103
- 468 Dottie Ct Unit 102
- 453 Paul Tell Trail Unit 115
- 478 Dottie Ct Unit 104
- 72 Waterford Way Unit 26
- 460 Paul Tell Trail Unit 128
- 483 Treasure Ln Unit 101
- 78 Waterford Way Unit 25
- 482 Dottie Ct Unit 105
- 68 Waterford Way Unit 27