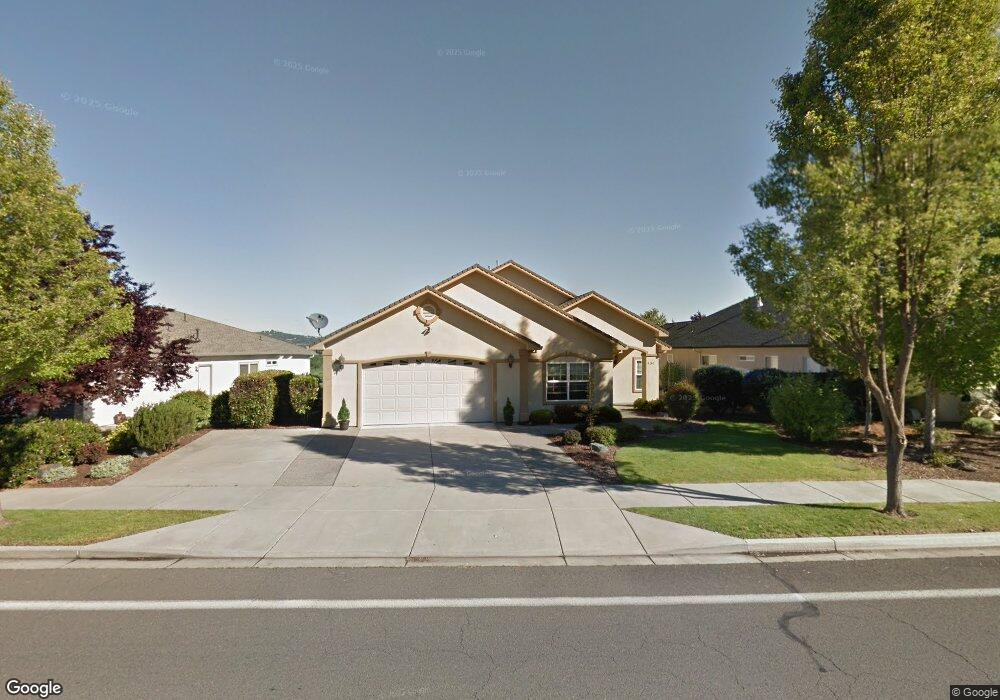
436 Robert Trent Jones Jr Blvd Eagle Point, OR
Estimated Value: $550,055 - $653,000
3
Beds
2
Baths
2,307
Sq Ft
$268/Sq Ft
Est. Value
About This Home
This home is located at 436 Robert Trent Jones Jr Blvd, Eagle Point, OR and is currently estimated at $618,014, approximately $267 per square foot. 436 Robert Trent Jones Jr Blvd is a home located in Jackson County with nearby schools including Eagle Point Middle School, White Mountain Middle School, and Eagle Point High School.
Ownership History
Date
Name
Owned For
Owner Type
Purchase Details
Closed on
Jul 2, 2004
Sold by
Robinson Cynthia A
Bought by
Machado Joe and Machado Maria
Current Estimated Value
Home Financials for this Owner
Home Financials are based on the most recent Mortgage that was taken out on this home.
Original Mortgage
$240,000
Interest Rate
6.27%
Mortgage Type
Purchase Money Mortgage
Purchase Details
Closed on
May 24, 2001
Sold by
Riverdell Construction Inc
Bought by
Robinson Cynthia A
Home Financials for this Owner
Home Financials are based on the most recent Mortgage that was taken out on this home.
Original Mortgage
$240,000
Interest Rate
7.15%
Purchase Details
Closed on
Oct 31, 2000
Sold by
Eagle Point Developments Llc
Bought by
Riverdell Construction Inc
Home Financials for this Owner
Home Financials are based on the most recent Mortgage that was taken out on this home.
Original Mortgage
$223,000
Interest Rate
7.89%
Mortgage Type
Credit Line Revolving
Create a Home Valuation Report for This Property
The Home Valuation Report is an in-depth analysis detailing your home's value as well as a comparison with similar homes in the area
Home Values in the Area
Average Home Value in this Area
Purchase History
| Date | Buyer | Sale Price | Title Company |
|---|---|---|---|
| Machado Joe | $375,000 | Amerititle | |
| Robinson Cynthia A | $300,000 | Amerititle | |
| Riverdell Construction Inc | $69,500 | Amerititle |
Source: Public Records
Mortgage History
| Date | Status | Borrower | Loan Amount |
|---|---|---|---|
| Closed | Machado Joe | $240,000 | |
| Previous Owner | Robinson Cynthia A | $240,000 | |
| Previous Owner | Riverdell Construction Inc | $223,000 | |
| Closed | Robinson Cynthia A | $45,000 |
Source: Public Records
Tax History Compared to Growth
Tax History
| Year | Tax Paid | Tax Assessment Tax Assessment Total Assessment is a certain percentage of the fair market value that is determined by local assessors to be the total taxable value of land and additions on the property. | Land | Improvement |
|---|---|---|---|---|
| 2025 | $6,124 | $447,560 | $123,150 | $324,410 |
| 2024 | $6,124 | $434,530 | $119,560 | $314,970 |
| 2023 | $5,916 | $421,880 | $116,080 | $305,800 |
| 2022 | $5,755 | $421,880 | $116,080 | $305,800 |
| 2021 | $5,585 | $409,600 | $112,700 | $296,900 |
| 2020 | $5,933 | $397,670 | $109,410 | $288,260 |
| 2019 | $5,842 | $374,850 | $103,130 | $271,720 |
| 2018 | $5,731 | $363,940 | $100,130 | $263,810 |
| 2017 | $5,590 | $363,940 | $100,130 | $263,810 |
| 2016 | $5,481 | $343,050 | $94,380 | $248,670 |
| 2015 | $5,302 | $343,050 | $94,380 | $248,670 |
| 2014 | $5,138 | $323,360 | $88,960 | $234,400 |
Source: Public Records
Map
Nearby Homes
- 422 Robert Trent Jones Blvd
- 495 Quail Run
- 398 Robert Trent Jones Blvd
- 427 Quail Run Unit 74
- 421 Quail Run Unit 75
- 433 Quail Run Unit 73
- 439 Quail Run Unit 72
- 1226 Stonegate Dr
- 384 Robert Trent Jones Blvd
- 1231 Poppy Ridge Dr
- 480 Pinnacle Ridge Unit 90
- 474 Pinnacle Ridge Unit 89
- 455 Pinnacle Ridge Unit 76
- 449 Pinnacle Ridge Unit 77
- 375 Robert Trent Jones Blvd
- 1255 Poppy Ridge Dr
- 1170 Pumpkin Ridge Unit 331
- 494 Pinnacle Ridge
- 1165 Pumpkin Unit 324
- 1171 Pumpkin Unit 325
- 436 Robert Trent Jones Blvd
- 440 Robert Trent Jones Blvd
- 448 Robert Trent Jones Blvd
- 430 Robert Trent Jones Jr Blvd
- 430 Robert Trent Jones Blvd
- 454 Robert Trent Jones Blvd
- 454 Robert Trent Jones Jr
- 437 Robert Trent Jones Jr
- 437 Robert T Jones Jr Blvd
- 437 Robert Trent Jones Blvd
- 451 Robert Trent Jones Blvd
- 451 Robert Trent Jones Jr Blvd
- 427 Robert T Jones Jr Blvd
- 460 Robert Trent Jones Blvd
- 427 Robert Trent Jones Blvd
- 414 Robert Trent Jones Blvd
- 457 Robert T Jones Jr Blvd
- 457 Robert Trent Jones Blvd
- 457 Robert Trent Jones Jr Blvd
- 466 Robert Trent Jones Blvd