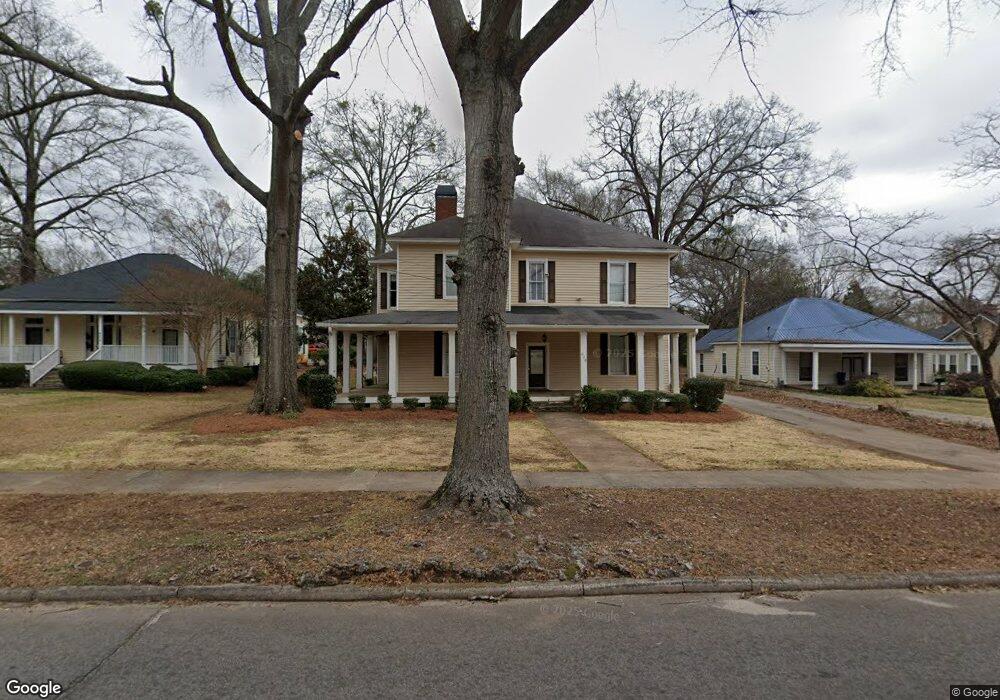
436 S 6th St Griffin, GA 30224
Spalding County NeighborhoodEstimated Value: $278,000 - $1,046,000
4
Beds
4
Baths
4,731
Sq Ft
$118/Sq Ft
Est. Value
About This Home
This home is located at 436 S 6th St, Griffin, GA 30224 and is currently estimated at $556,667, approximately $117 per square foot. 436 S 6th St is a home located in Spalding County with nearby schools including Futral Road Elementary School, Rehoboth Road Middle School, and Spalding High School.
Ownership History
Date
Name
Owned For
Owner Type
Purchase Details
Closed on
Dec 31, 2024
Sold by
Ljh Properties Llc
Bought by
Jsk Md Llc
Current Estimated Value
Home Financials for this Owner
Home Financials are based on the most recent Mortgage that was taken out on this home.
Original Mortgage
$755,000
Outstanding Balance
$657,163
Interest Rate
6.69%
Mortgage Type
Mortgage Modification
Estimated Equity
-$100,496
Purchase Details
Closed on
Nov 3, 2011
Sold by
Dunson Dan L
Bought by
Ljh Properties Llc
Purchase Details
Closed on
Jun 29, 1999
Sold by
Lovin Johnny E
Bought by
Dunson Dan L and Dunson Nancy M
Purchase Details
Closed on
Jan 1, 1979
Sold by
Dowis Max R
Bought by
Lovin Johnny E
Purchase Details
Closed on
Jul 1, 1970
Sold by
Thomas Nell M
Bought by
Dowis Max R
Purchase Details
Closed on
May 20, 1969
Sold by
Thomas John S and Mrs Nell M
Bought by
Thomas Nell M
Purchase Details
Closed on
Sep 27, 1952
Bought by
Thomas John S and Thomas Nell M
Create a Home Valuation Report for This Property
The Home Valuation Report is an in-depth analysis detailing your home's value as well as a comparison with similar homes in the area
Home Values in the Area
Average Home Value in this Area
Purchase History
| Date | Buyer | Sale Price | Title Company |
|---|---|---|---|
| Jsk Md Llc | $893,750 | -- | |
| Ljh Properties Llc | $107,500 | -- | |
| Dunson Dan L | $150,000 | -- | |
| Lovin Johnny E | $32,000 | -- | |
| Dowis Max R | $16,000 | -- | |
| Thomas Nell M | -- | -- | |
| Thomas John S | -- | -- |
Source: Public Records
Mortgage History
| Date | Status | Borrower | Loan Amount |
|---|---|---|---|
| Open | Jsk Md Llc | $755,000 |
Source: Public Records
Tax History Compared to Growth
Tax History
| Year | Tax Paid | Tax Assessment Tax Assessment Total Assessment is a certain percentage of the fair market value that is determined by local assessors to be the total taxable value of land and additions on the property. | Land | Improvement |
|---|---|---|---|---|
| 2024 | $7,228 | $189,290 | $12,500 | $176,790 |
| 2023 | $7,228 | $129,400 | $12,500 | $116,900 |
| 2022 | $6,166 | $154,297 | $12,500 | $141,797 |
| 2021 | $4,703 | $117,693 | $12,500 | $105,193 |
| 2020 | $4,703 | $117,693 | $12,500 | $105,193 |
| 2019 | $4,790 | $117,693 | $12,500 | $105,193 |
| 2018 | $2,296 | $54,368 | $16,000 | $38,368 |
| 2017 | $2,247 | $54,368 | $16,000 | $38,368 |
| 2016 | $2,283 | $54,368 | $16,000 | $38,368 |
| 2015 | $2,321 | $54,368 | $16,000 | $38,368 |
| 2014 | $2,391 | $54,368 | $16,000 | $38,368 |
Source: Public Records
Map
Nearby Homes
- 523 S 6th St
- 18 Terracedale Ct
- 541 S 6th St
- 40 Terrace St
- 115 Kennelsman Dr Unit LOT FC 1
- 134 Townsend Ct
- 304 Tilney Ave
- 650 S Hill St
- 406 E Solomon St
- 102 N Hill St Unit 304
- 102 N Hill St Unit 303
- 706 Maple Dr
- 714 Maple Dr
- 216 N 6th St
- 320 S 12th St
- 223 N 5th St
- 222 E Chappell St
- 218 W Central Ave
- 727 E Slaton Ave
- 314 E Quilly St