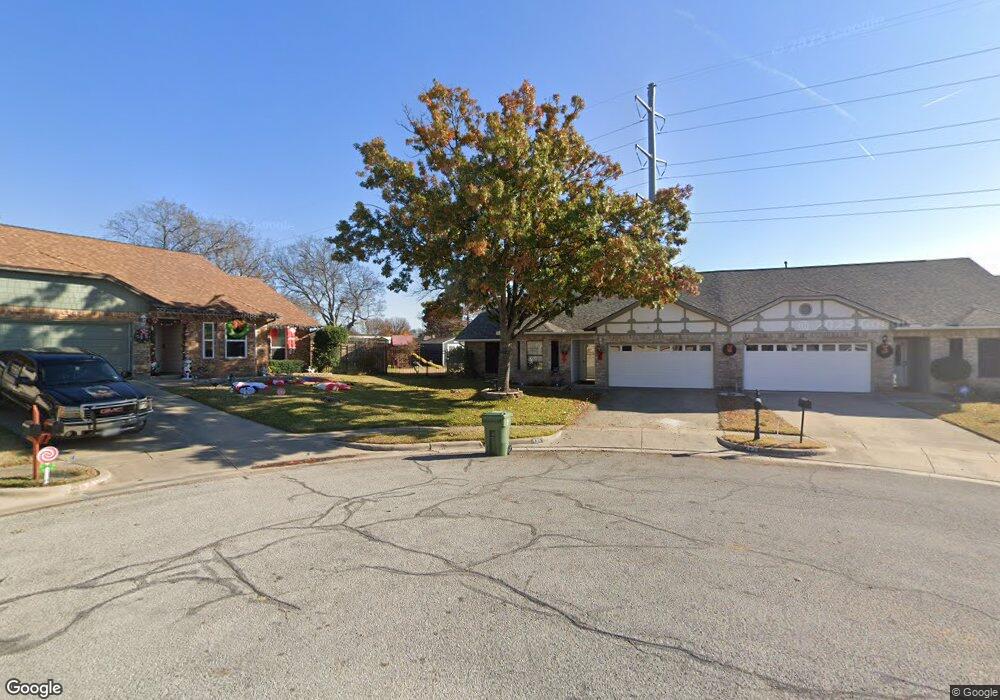
436 Sunnybrook Ct Bedford, TX 76021
Estimated Value: $317,000 - $357,000
3
Beds
2
Baths
1,567
Sq Ft
$210/Sq Ft
Est. Value
About This Home
This home is located at 436 Sunnybrook Ct, Bedford, TX 76021 and is currently estimated at $329,810, approximately $210 per square foot. 436 Sunnybrook Ct is a home located in Tarrant County with nearby schools including Shady Oaks Elementary School, Bedford Junior High School, and L.D. Bell High School.
Ownership History
Date
Name
Owned For
Owner Type
Purchase Details
Closed on
Sep 11, 2020
Sold by
White Anthony Boyd and White Randal Shawn
Bought by
Jeusen Dillion Mitchell
Current Estimated Value
Home Financials for this Owner
Home Financials are based on the most recent Mortgage that was taken out on this home.
Original Mortgage
$208,800
Outstanding Balance
$185,296
Interest Rate
2.9%
Mortgage Type
New Conventional
Estimated Equity
$144,514
Purchase Details
Closed on
Jul 22, 2016
Sold by
White George W
Bought by
White Anthony Boyd and White Randal Shawn
Purchase Details
Closed on
Jul 21, 2016
Sold by
White George W
Bought by
White George W
Purchase Details
Closed on
Jun 1, 1998
Sold by
Vann Doris Evelyn Nelson and Nelson Doris Evelyn
Bought by
White George W and White Marjorie B
Home Financials for this Owner
Home Financials are based on the most recent Mortgage that was taken out on this home.
Original Mortgage
$35,000
Interest Rate
7.2%
Mortgage Type
Seller Take Back
Create a Home Valuation Report for This Property
The Home Valuation Report is an in-depth analysis detailing your home's value as well as a comparison with similar homes in the area
Home Values in the Area
Average Home Value in this Area
Purchase History
| Date | Buyer | Sale Price | Title Company |
|---|---|---|---|
| Jeusen Dillion Mitchell | -- | Capital Title | |
| White Anthony Boyd | -- | None Available | |
| White George W | -- | None Available | |
| White George W | -- | Rattikin Title Co |
Source: Public Records
Mortgage History
| Date | Status | Borrower | Loan Amount |
|---|---|---|---|
| Open | Jeusen Dillion Mitchell | $208,800 | |
| Previous Owner | White George W | $35,000 |
Source: Public Records
Tax History Compared to Growth
Tax History
| Year | Tax Paid | Tax Assessment Tax Assessment Total Assessment is a certain percentage of the fair market value that is determined by local assessors to be the total taxable value of land and additions on the property. | Land | Improvement |
|---|---|---|---|---|
| 2025 | $3,705 | $312,124 | $25,000 | $287,124 |
| 2024 | $3,705 | $312,124 | $25,000 | $287,124 |
| 2023 | $4,402 | $314,497 | $25,000 | $289,497 |
| 2022 | $4,557 | $246,513 | $25,000 | $221,513 |
| 2021 | $4,468 | $189,680 | $25,000 | $164,680 |
| 2020 | $4,262 | $191,008 | $25,000 | $166,008 |
| 2019 | $3,959 | $206,750 | $25,000 | $181,750 |
| 2018 | $847 | $148,140 | $25,000 | $123,140 |
| 2017 | $3,258 | $165,387 | $25,000 | $140,387 |
| 2016 | $2,962 | $138,623 | $25,000 | $113,623 |
| 2015 | $894 | $111,300 | $16,000 | $95,300 |
| 2014 | $894 | $111,300 | $16,000 | $95,300 |
Source: Public Records
Map
Nearby Homes
- 432 Sunnybrook Ct
- 121 Kay Ct
- 124 Jeannie Ct
- 1732 Jeannie Ln
- 817 Shady Lake Dr
- 1740 Brown Trail
- 320 Blue Quail Ct
- 2436 Brookgreen Ct
- 801 Shady Creek Ln
- 3119 Spring Grove Dr
- 100 Hillview Ct
- 3213 Spring Valley Dr
- 305 Warbler Dr
- 2420 Stonegate Dr N
- 922 Shady Creek Ln
- 421 Cavender Ct
- 1013 Springdale Rd
- 913 Kensington Ct
- 405 Woodbriar Ct
- 2501 Shady Grove Dr
- 440 Sunnybrook Ct
- 428 Sunnybrook Ct
- 441 Sunnybrook Ct
- 424 Sunnybrook Ct
- 421 Miranda Terrace
- 437 Sunnybrook Ct
- 420 Sunnybrook Ct
- 433 Sunnybrook Ct
- 417 Miranda Terrace
- 429 Sunnybrook Ct
- 425 Miranda Terrace
- 425 Sunnybrook Ct
- 416 Sunnybrook Ct
- 413 Miranda Terrace
- 421 Sunnybrook Ct
- 429 Miranda Terrace
- 412 Sunnybrook Ct
- 442 Sunnybrook Ct
- 417 Sunnybrook Ct
- 408 Sunnybrook Ct