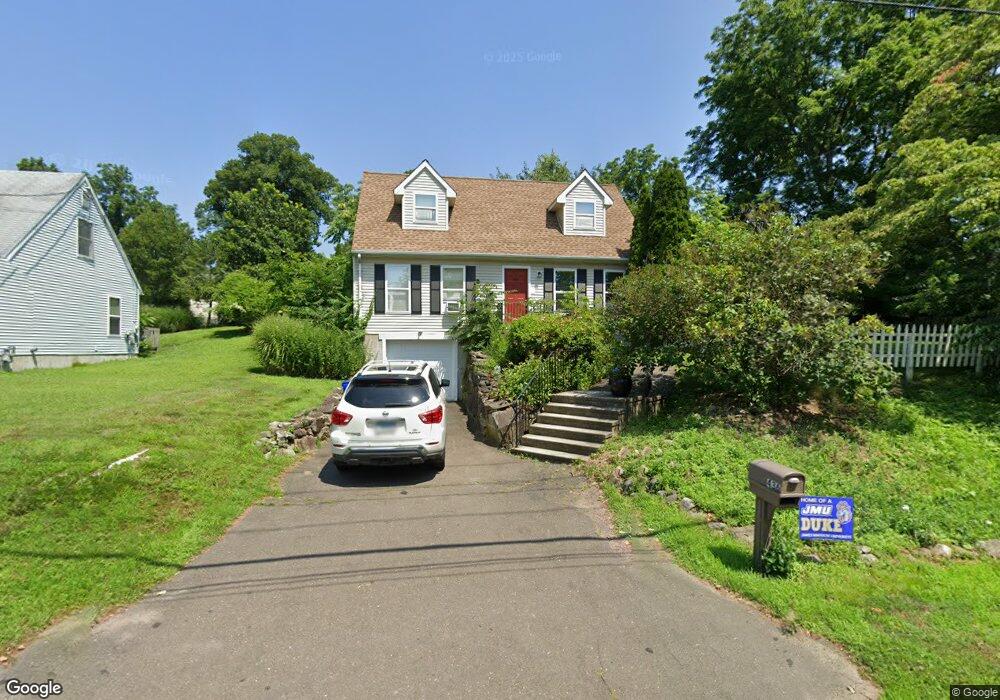
436 Unquowa Rd Fairfield, CT 06824
Fairfield Center NeighborhoodEstimated Value: $584,000 - $772,000
3
Beds
3
Baths
1,210
Sq Ft
$583/Sq Ft
Est. Value
About This Home
This home is located at 436 Unquowa Rd, Fairfield, CT 06824 and is currently estimated at $705,492, approximately $583 per square foot. 436 Unquowa Rd is a home located in Fairfield County with nearby schools including Riverfield Elementary School, Roger Ludlowe Middle School, and Fairfield Ludlowe High School.
Ownership History
Date
Name
Owned For
Owner Type
Purchase Details
Closed on
Jun 18, 2021
Sold by
Deaky Valerie
Bought by
Peterson Alyssa A
Current Estimated Value
Home Financials for this Owner
Home Financials are based on the most recent Mortgage that was taken out on this home.
Original Mortgage
$380,000
Outstanding Balance
$344,043
Interest Rate
2.9%
Mortgage Type
Purchase Money Mortgage
Estimated Equity
$361,449
Purchase Details
Closed on
Jul 15, 2020
Sold by
Anderson Lars A and Anderson Kathleen M
Bought by
Deaky Valerie
Purchase Details
Closed on
May 3, 1996
Sold by
Eastern Property Asset
Bought by
Anderson Lars A and Anderson Kathleen M
Home Financials for this Owner
Home Financials are based on the most recent Mortgage that was taken out on this home.
Original Mortgage
$142,400
Interest Rate
7.82%
Mortgage Type
Unknown
Purchase Details
Closed on
Aug 11, 1995
Sold by
Lutheran Hsng Fairfiel
Bought by
Eastern Prop Assets
Create a Home Valuation Report for This Property
The Home Valuation Report is an in-depth analysis detailing your home's value as well as a comparison with similar homes in the area
Home Values in the Area
Average Home Value in this Area
Purchase History
| Date | Buyer | Sale Price | Title Company |
|---|---|---|---|
| Peterson Alyssa A | $400,000 | None Available | |
| Peterson Alyssa A | $400,000 | None Available | |
| Deaky Valerie | $400,000 | None Available | |
| Deaky Valerie | $400,000 | None Available | |
| Anderson Lars A | $149,900 | -- | |
| Anderson Lars A | $149,900 | -- | |
| Eastern Prop Assets | $357,000 | -- |
Source: Public Records
Mortgage History
| Date | Status | Borrower | Loan Amount |
|---|---|---|---|
| Open | Peterson Alyssa A | $380,000 | |
| Closed | Peterson Alyssa A | $380,000 | |
| Previous Owner | Eastern Prop Assets | $177,000 | |
| Previous Owner | Eastern Prop Assets | $162,000 | |
| Previous Owner | Eastern Prop Assets | $142,400 |
Source: Public Records
Tax History Compared to Growth
Tax History
| Year | Tax Paid | Tax Assessment Tax Assessment Total Assessment is a certain percentage of the fair market value that is determined by local assessors to be the total taxable value of land and additions on the property. | Land | Improvement |
|---|---|---|---|---|
| 2025 | $7,981 | $281,120 | $209,930 | $71,190 |
| 2024 | $7,843 | $281,120 | $209,930 | $71,190 |
| 2023 | $7,734 | $281,120 | $209,930 | $71,190 |
| 2022 | $7,658 | $281,120 | $209,930 | $71,190 |
| 2021 | $7,585 | $281,120 | $209,930 | $71,190 |
| 2020 | $4,225 | $157,710 | $83,860 | $73,850 |
| 2019 | $4,225 | $157,710 | $83,860 | $73,850 |
| 2018 | $4,157 | $157,710 | $83,860 | $73,850 |
| 2017 | $4,072 | $157,710 | $83,860 | $73,850 |
| 2016 | $4,014 | $157,710 | $83,860 | $73,850 |
| 2015 | $3,707 | $149,520 | $88,270 | $61,250 |
| 2014 | $3,648 | $149,520 | $88,270 | $61,250 |
Source: Public Records
Map
Nearby Homes
- 245 Unquowa Rd Unit 34
- 245 Unquowa Rd Unit 11
- 245 Unquowa Rd Unit 33
- 20 Ermine St
- 21 Beaumont St
- 43 Helen St
- 226 Ruane St
- 294 Catherine Terrace
- 345 Reef Rd Unit B6
- 345 Reef Rd Unit C9
- 38 Edge Hill Rd
- 647 Bronson Rd
- 57 Beaumont Place
- 127 Paul Place
- 209 S Pine Creek Rd
- 196 Catherine Terrace
- 400 Bronson Rd
- 83 Pell Meadow Dr
- 137 Millard St
- 88 Overhill Rd
- 99 Durrell Dr
- 458 Unquowa Rd
- 63 Durrell Dr
- 23 Durrell Dr
- 285 Papermill Ln
- 21 Durrell Dr
- 273 Papermill Ln
- 257 Papermill Ln
- 296 Papermill Ln
- 266 Papermill Ln
- 241 Papermill Ln
- 254 Papermill Ln
- 375 Unquowa Rd
- 377 Unquowa Rd
- 377 Unquowa Rd Unit 377
- 530 Unquowa Rd
- 379 Unquowa Rd
- 379 Unquowa Rd Unit 379
- 381 Unquowa Rd
- 381 Unquowa Rd Unit 381