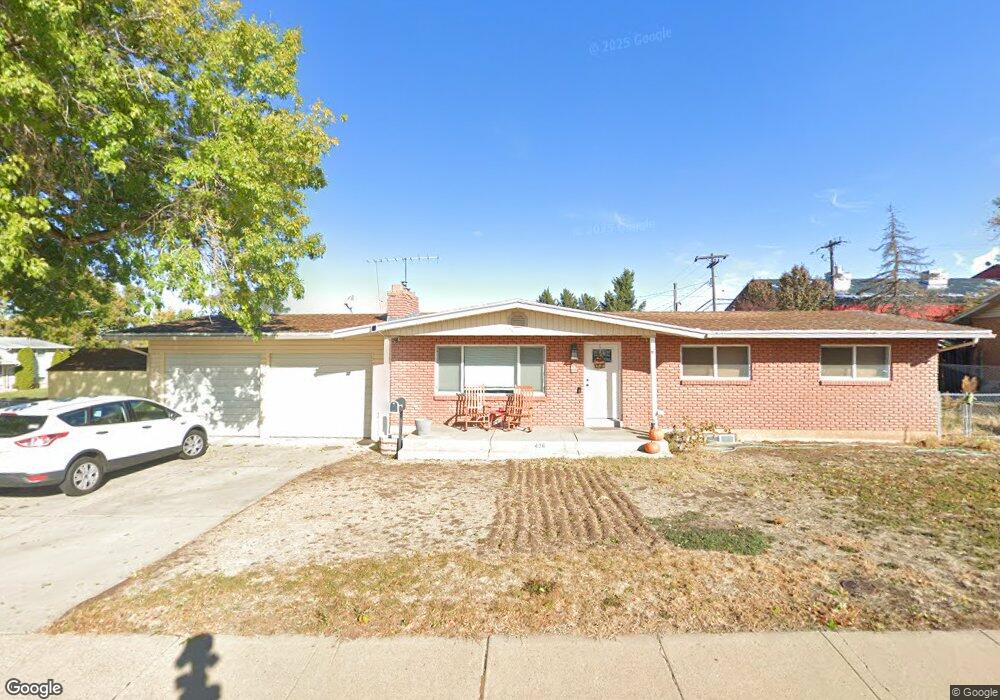
436 W 1185 N Clearfield, UT 84015
Estimated Value: $402,000 - $425,000
5
Beds
2
Baths
2,350
Sq Ft
$178/Sq Ft
Est. Value
About This Home
This home is located at 436 W 1185 N, Clearfield, UT 84015 and is currently estimated at $417,208, approximately $177 per square foot. 436 W 1185 N is a home located in Davis County with nearby schools including Doxey School, Sunset Junior High School, and Northridge High School.
Ownership History
Date
Name
Owned For
Owner Type
Purchase Details
Closed on
Aug 9, 2021
Sold by
Copeland Kristen
Bought by
Copeland Kristen and Copeland Dustin Travis
Current Estimated Value
Home Financials for this Owner
Home Financials are based on the most recent Mortgage that was taken out on this home.
Original Mortgage
$230,000
Outstanding Balance
$208,689
Interest Rate
2.9%
Mortgage Type
New Conventional
Estimated Equity
$208,519
Purchase Details
Closed on
Jul 7, 2017
Sold by
Montgomery Michael D
Bought by
Copeland Kristen
Home Financials for this Owner
Home Financials are based on the most recent Mortgage that was taken out on this home.
Original Mortgage
$150,000
Interest Rate
3.95%
Mortgage Type
New Conventional
Purchase Details
Closed on
Oct 25, 2016
Sold by
Bach Zachary W J and Bach Crystal G
Bought by
Montgomery Michael D
Purchase Details
Closed on
Oct 15, 2007
Sold by
Garcia Joan
Bought by
Garcia Joan
Create a Home Valuation Report for This Property
The Home Valuation Report is an in-depth analysis detailing your home's value as well as a comparison with similar homes in the area
Home Values in the Area
Average Home Value in this Area
Purchase History
| Date | Buyer | Sale Price | Title Company |
|---|---|---|---|
| Copeland Kristen | -- | Backman Title Services | |
| Copeland Kristen | -- | Gt Title | |
| Montgomery Michael D | -- | Backman Title | |
| Garcia Joan | -- | None Available |
Source: Public Records
Mortgage History
| Date | Status | Borrower | Loan Amount |
|---|---|---|---|
| Open | Copeland Kristen | $230,000 | |
| Closed | Copeland Kristen | $150,000 |
Source: Public Records
Tax History Compared to Growth
Tax History
| Year | Tax Paid | Tax Assessment Tax Assessment Total Assessment is a certain percentage of the fair market value that is determined by local assessors to be the total taxable value of land and additions on the property. | Land | Improvement |
|---|---|---|---|---|
| 2025 | $2,551 | $232,650 | $72,833 | $159,817 |
| 2024 | $2,472 | $225,500 | $69,600 | $155,900 |
| 2023 | $2,315 | $385,000 | $110,958 | $274,042 |
| 2022 | $2,492 | $224,400 | $63,241 | $161,159 |
| 2021 | $2,149 | $304,000 | $69,276 | $234,724 |
| 2020 | $1,868 | $260,000 | $58,665 | $201,335 |
| 2019 | $1,654 | $236,000 | $72,648 | $163,352 |
| 2018 | $1,482 | $207,000 | $58,057 | $148,943 |
| 2016 | $1,258 | $90,310 | $27,460 | $62,850 |
| 2015 | $1,180 | $80,245 | $27,460 | $52,785 |
| 2014 | $1,178 | $81,864 | $27,460 | $54,404 |
| 2013 | -- | $73,218 | $23,265 | $49,953 |
Source: Public Records
Map
Nearby Homes