436 W Bow St Thorntown, IN 46071
Estimated Value: $127,000 - $231,000
2
Beds
1
Bath
1,024
Sq Ft
$173/Sq Ft
Est. Value
About This Home
This home is located at 436 W Bow St, Thorntown, IN 46071 and is currently estimated at $176,644, approximately $172 per square foot. 436 W Bow St is a home located in Boone County with nearby schools including Western Boone Junior/Senior High School.
Ownership History
Date
Name
Owned For
Owner Type
Purchase Details
Closed on
Jul 31, 2018
Sold by
Gideon George W and Gideon Susan K
Bought by
Sutton Stacey R
Current Estimated Value
Home Financials for this Owner
Home Financials are based on the most recent Mortgage that was taken out on this home.
Original Mortgage
$67,676
Outstanding Balance
$58,651
Interest Rate
4.5%
Mortgage Type
New Conventional
Estimated Equity
$117,993
Purchase Details
Closed on
Oct 14, 2011
Sold by
Hsbc Mortgage Services Inc
Bought by
Gideon George W and Gideon Susan K
Purchase Details
Closed on
May 5, 2011
Sold by
Toney Eugene D and Toney Sherrie A
Bought by
Hsbc Mortgage Services Inc
Create a Home Valuation Report for This Property
The Home Valuation Report is an in-depth analysis detailing your home's value as well as a comparison with similar homes in the area
Home Values in the Area
Average Home Value in this Area
Purchase History
| Date | Buyer | Sale Price | Title Company |
|---|---|---|---|
| Sutton Stacey R | -- | Nations Title | |
| Gideon George W | -- | -- | |
| Hsbc Mortgage Services Inc | $44,805 | -- |
Source: Public Records
Mortgage History
| Date | Status | Borrower | Loan Amount |
|---|---|---|---|
| Open | Sutton Stacey R | $67,676 |
Source: Public Records
Tax History Compared to Growth
Tax History
| Year | Tax Paid | Tax Assessment Tax Assessment Total Assessment is a certain percentage of the fair market value that is determined by local assessors to be the total taxable value of land and additions on the property. | Land | Improvement |
|---|---|---|---|---|
| 2025 | $834 | $137,700 | $16,400 | $121,300 |
| 2024 | $834 | $128,500 | $16,400 | $112,100 |
| 2023 | $747 | $116,900 | $16,400 | $100,500 |
| 2022 | $701 | $109,200 | $16,400 | $92,800 |
| 2021 | $569 | $94,300 | $16,400 | $77,900 |
| 2020 | $469 | $85,800 | $16,400 | $69,400 |
| 2019 | $425 | $82,900 | $16,400 | $66,500 |
| 2018 | $424 | $78,600 | $16,400 | $62,200 |
| 2017 | $1,338 | $72,500 | $16,400 | $56,100 |
| 2016 | $1,222 | $69,200 | $16,400 | $52,800 |
| 2014 | $1,070 | $60,800 | $16,400 | $44,400 |
| 2013 | $1,141 | $60,800 | $16,400 | $44,400 |
Source: Public Records
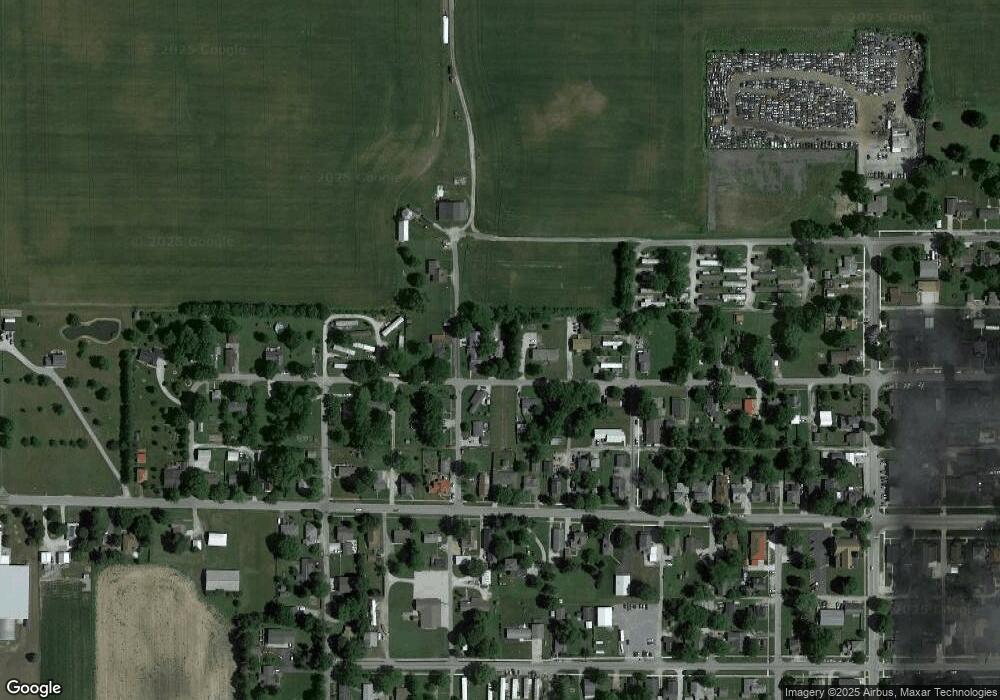
Map
Nearby Homes
- 223 S West St
- 117 N Market St
- 328 N Front St
- 1323 Locust Place
- 1321 Locust Place
- Ironwood Plan at Northwood Haven
- Spruce Plan at Northwood Haven
- Ashton Plan at Northwood Haven
- Palmetto Plan at Northwood Haven
- Bradford Plan at Northwood Haven
- Aspen II Plan at Northwood Haven
- Empress Plan at Northwood Haven
- Juniper Plan at Northwood Haven
- Chestnut Plan at Northwood Haven
- Norway Plan at Northwood Haven
- Cooper Plan at Northwood Haven
- 6139 Westfall Dr
- Juniper Plan at Westfall Place
- Chestnut Plan at Westfall Place
- Walnut Plan at Westfall Place