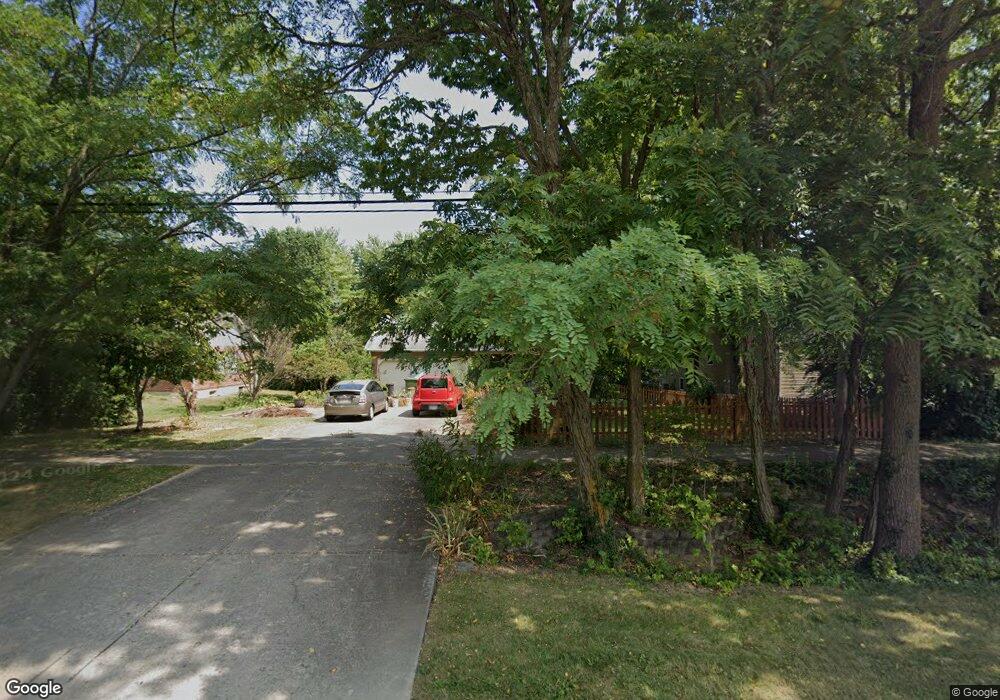
4360 Oxford Reily Rd Oxford, OH 45056
Estimated Value: $282,000 - $335,000
3
Beds
3
Baths
1,806
Sq Ft
$174/Sq Ft
Est. Value
About This Home
This home is located at 4360 Oxford Reily Rd, Oxford, OH 45056 and is currently estimated at $314,352, approximately $174 per square foot. 4360 Oxford Reily Rd is a home located in Butler County with nearby schools including Talawanda Middle School, Talawanda High School, and Mcguffey Montessori School.
Ownership History
Date
Name
Owned For
Owner Type
Purchase Details
Closed on
Dec 21, 2000
Sold by
Blakley Jennifer L and Blakley Jody L
Bought by
Hofmann Robert G and Hofmann Meredith P
Current Estimated Value
Home Financials for this Owner
Home Financials are based on the most recent Mortgage that was taken out on this home.
Original Mortgage
$134,000
Outstanding Balance
$49,629
Interest Rate
7.77%
Mortgage Type
Unknown
Estimated Equity
$264,723
Purchase Details
Closed on
Jun 12, 1998
Sold by
Leppman Elizabeth J
Bought by
Blakley Jody L and Sims Jennifer L
Home Financials for this Owner
Home Financials are based on the most recent Mortgage that was taken out on this home.
Original Mortgage
$109,250
Interest Rate
7.22%
Mortgage Type
Purchase Money Mortgage
Purchase Details
Closed on
Aug 18, 1997
Sold by
Stephens Craig A
Bought by
Leppman Elizabeth J
Home Financials for this Owner
Home Financials are based on the most recent Mortgage that was taken out on this home.
Original Mortgage
$79,500
Interest Rate
7.38%
Mortgage Type
New Conventional
Purchase Details
Closed on
Nov 15, 1993
Purchase Details
Closed on
Aug 1, 1988
Purchase Details
Closed on
Jan 1, 1988
Create a Home Valuation Report for This Property
The Home Valuation Report is an in-depth analysis detailing your home's value as well as a comparison with similar homes in the area
Home Values in the Area
Average Home Value in this Area
Purchase History
| Date | Buyer | Sale Price | Title Company |
|---|---|---|---|
| Hofmann Robert G | $134,000 | -- | |
| Blakley Jody L | $115,000 | -- | |
| Leppman Elizabeth J | $122,500 | -- | |
| -- | $111,000 | -- | |
| -- | $89,900 | -- | |
| -- | $54,900 | -- |
Source: Public Records
Mortgage History
| Date | Status | Borrower | Loan Amount |
|---|---|---|---|
| Open | Hofmann Robert G | $134,000 | |
| Previous Owner | Blakley Jody L | $109,250 | |
| Previous Owner | Leppman Elizabeth J | $79,500 |
Source: Public Records
Tax History Compared to Growth
Tax History
| Year | Tax Paid | Tax Assessment Tax Assessment Total Assessment is a certain percentage of the fair market value that is determined by local assessors to be the total taxable value of land and additions on the property. | Land | Improvement |
|---|---|---|---|---|
| 2024 | $3,332 | $90,380 | $15,520 | $74,860 |
| 2023 | $3,197 | $90,070 | $15,520 | $74,550 |
| 2022 | $2,709 | $69,740 | $15,520 | $54,220 |
| 2021 | $2,579 | $69,740 | $15,520 | $54,220 |
| 2020 | $2,696 | $69,740 | $15,520 | $54,220 |
| 2019 | $4,268 | $56,500 | $15,710 | $40,790 |
| 2018 | $2,304 | $56,500 | $15,710 | $40,790 |
| 2017 | $2,071 | $56,500 | $15,710 | $40,790 |
| 2016 | $2,004 | $52,920 | $15,710 | $37,210 |
| 2015 | $2,039 | $52,920 | $15,710 | $37,210 |
| 2014 | $2,331 | $52,920 | $15,710 | $37,210 |
| 2013 | $2,331 | $59,400 | $15,710 | $43,690 |
Source: Public Records
Map
Nearby Homes
- 715 W Chestnut St
- 40 Charleston Dr Unit 4
- 626 W Chestnut St
- 0 Dana Dr Unit 1860017
- 446 Emerald Woods Dr
- 509 White Oak Dr
- 620 Brill Dr
- 616 Brill Dr
- 812 Winding Brook Dr
- 6 Autumn Dr
- 7 Robin Ct
- 1020 Tollgate Dr
- 6135 Fairfield Rd
- 60 Autumn Dr
- 4215 Kehr Rd
- 53 Great Horned Dr
- 59 Great Horned Dr
- 71 Great Horned Dr
- 74 Great Horned Dr
- 80 Great Horned Dr
- 4370 Oxford Reily Rd
- 813 Melinda Dr
- 4380 Oxford Reily Rd
- 815 Melinda Dr
- 811 Melinda Dr
- 817 Melinda Dr
- 819 Melissa Dr
- 809 Melinda Dr
- 813 Melissa Dr
- 808 Melinda Dr
- 807 Melinda Dr
- 818 Melinda Dr
- 820 Melissa Dr
- 804 Melinda Dr
- 816 Melissa Dr
- 803 Melinda Dr Unit 1003
- 814 Melissa Dr
- 803 Melissa Dr
- 810 Melissa Dr
- 728 Melinda Dr