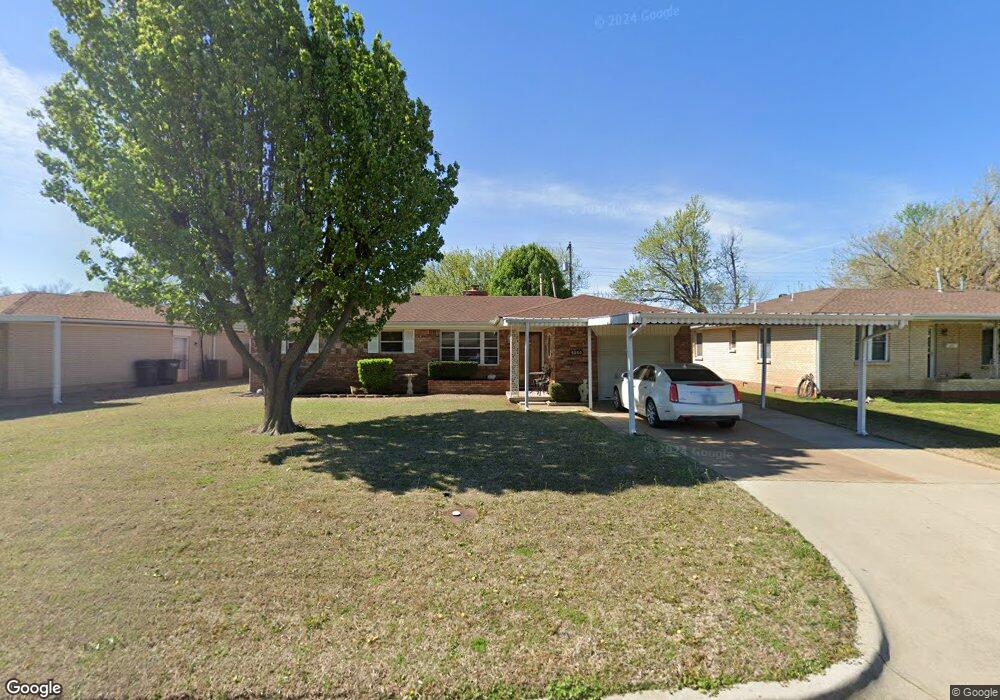
4360 Woodedge Dr Oklahoma City, OK 73115
Estimated Value: $138,000 - $177,000
2
Beds
2
Baths
1,587
Sq Ft
$99/Sq Ft
Est. Value
About This Home
This home is located at 4360 Woodedge Dr, Oklahoma City, OK 73115 and is currently estimated at $156,699, approximately $98 per square foot. 4360 Woodedge Dr is a home located in Oklahoma County with nearby schools including Del City Elementary School, Del City High School, and Christian Heritage Academy.
Ownership History
Date
Name
Owned For
Owner Type
Purchase Details
Closed on
Feb 28, 2018
Sold by
Tesney James Dean and Hawkinson Teresa Lynn
Bought by
Hawkinson Teresa Lynn
Current Estimated Value
Home Financials for this Owner
Home Financials are based on the most recent Mortgage that was taken out on this home.
Original Mortgage
$68,400
Outstanding Balance
$58,160
Interest Rate
4.15%
Mortgage Type
New Conventional
Estimated Equity
$98,539
Purchase Details
Closed on
Feb 20, 2018
Sold by
Tesney Steven Banks and Caplan Jerome Grant
Bought by
Aloway Jimmy Ray and Aloway Zadra Darlene
Home Financials for this Owner
Home Financials are based on the most recent Mortgage that was taken out on this home.
Original Mortgage
$68,400
Outstanding Balance
$58,160
Interest Rate
4.15%
Mortgage Type
New Conventional
Estimated Equity
$98,539
Purchase Details
Closed on
Mar 13, 1998
Sold by
Tesney James Dean and Tesney Rovella Ann
Bought by
Tesney James Dean and Tesney Rovella Ann
Create a Home Valuation Report for This Property
The Home Valuation Report is an in-depth analysis detailing your home's value as well as a comparison with similar homes in the area
Home Values in the Area
Average Home Value in this Area
Purchase History
| Date | Buyer | Sale Price | Title Company |
|---|---|---|---|
| Hawkinson Teresa Lynn | -- | First American Title | |
| Aloway Jimmy Ray | $85,500 | First American Title | |
| Tesney James Dean | -- | -- |
Source: Public Records
Mortgage History
| Date | Status | Borrower | Loan Amount |
|---|---|---|---|
| Open | Aloway Jimmy Ray | $68,400 |
Source: Public Records
Tax History Compared to Growth
Tax History
| Year | Tax Paid | Tax Assessment Tax Assessment Total Assessment is a certain percentage of the fair market value that is determined by local assessors to be the total taxable value of land and additions on the property. | Land | Improvement |
|---|---|---|---|---|
| 2024 | $951 | $9,460 | $1,698 | $7,762 |
| 2023 | $951 | $9,460 | $1,364 | $8,096 |
| 2022 | $937 | $9,460 | $1,514 | $7,946 |
| 2021 | $970 | $9,460 | $1,727 | $7,733 |
| 2020 | $996 | $9,460 | $1,931 | $7,529 |
| 2019 | $966 | $9,460 | $1,836 | $7,624 |
| 2018 | $973 | $8,402 | $0 | $0 |
| 2017 | $816 | $8,001 | $1,526 | $6,475 |
| 2016 | $839 | $8,001 | $1,562 | $6,439 |
| 2015 | $844 | $8,001 | $1,644 | $6,357 |
| 2014 | $842 | $8,001 | $1,663 | $6,338 |
Source: Public Records
Map
Nearby Homes
- 4345 Woodedge Dr
- 4316 SE 13th St
- 1608 Hanna Dr
- 4108 SE 10th St
- 4109 SE 14th St
- 1021 Vickie Dr
- 1600 Elm Dr
- 4704 Lisa Ln
- 1645 Lariet Ln
- 720 Del Haven Dr
- 3724 SE 15th St
- 4804 Vera Place
- 4409 SE 20th St
- 4812 Del Crest Dr
- 4037 Thomas Ave
- 4800 Gina Place
- 3924 SE 14th St
- 3918 SE 12th St
- 3921 SE 11th St
- 3917 SE 12th St
- 4356 Woodedge Dr
- 4400 Woodedge Dr
- 4352 Woodedge Dr
- 4349 SE 12th St
- 4353 SE 12th St
- 4345 SE 12th St
- 4373 Woodedge Dr
- 4369 Woodedge Dr
- 4408 Woodedge Dr
- 4401 Woodedge Dr
- 4348 Woodedge Dr
- 4365 Woodedge Dr
- 4341 SE 12th St
- 4357 SE 12th St
- 4405 Woodedge Dr
- 4412 Woodedge Dr
- 4361 Woodedge Dr
- 4344 Woodedge Dr
- 4417 Woodedge Dr
- 4337 SE 12th St