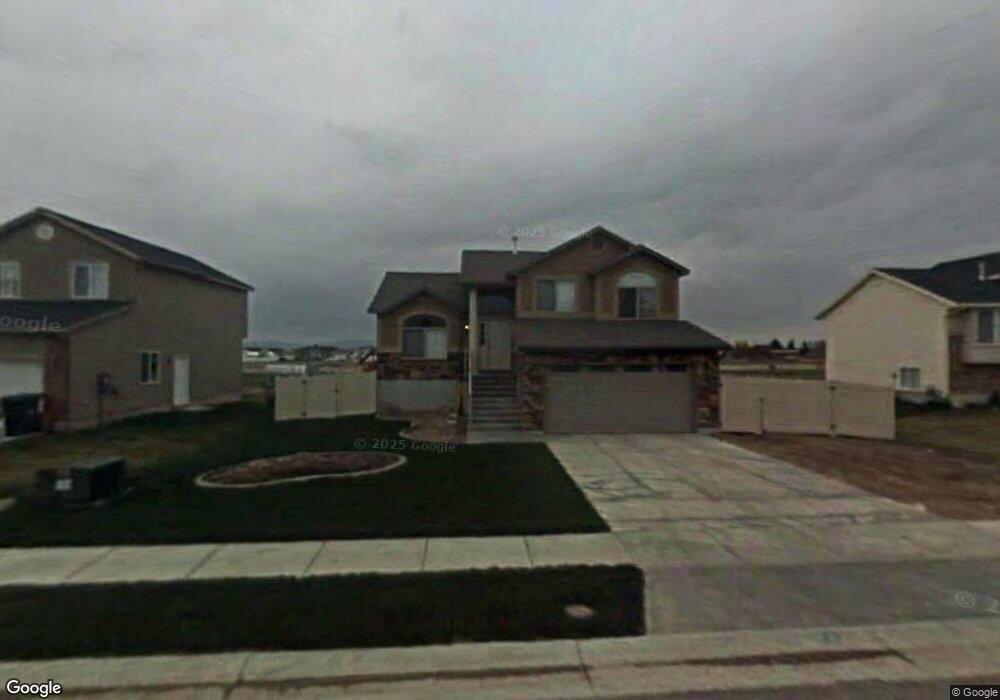
4361 S 3450 W West Haven, UT 84401
Estimated Value: $451,000 - $496,000
3
Beds
3
Baths
2,097
Sq Ft
$225/Sq Ft
Est. Value
About This Home
This home is located at 4361 S 3450 W, West Haven, UT 84401 and is currently estimated at $472,412, approximately $225 per square foot. 4361 S 3450 W is a home located in Weber County with nearby schools including West Haven School, Sand Ridge Junior High School, and Roy High School.
Ownership History
Date
Name
Owned For
Owner Type
Purchase Details
Closed on
Aug 9, 2007
Sold by
Great American Homes Inc
Bought by
Goncalves Nicholas A
Current Estimated Value
Home Financials for this Owner
Home Financials are based on the most recent Mortgage that was taken out on this home.
Original Mortgage
$169,200
Outstanding Balance
$107,566
Interest Rate
6.74%
Mortgage Type
Purchase Money Mortgage
Estimated Equity
$364,846
Purchase Details
Closed on
Mar 23, 2006
Sold by
Northern Developers Llc
Bought by
Great American Homes Inc
Home Financials for this Owner
Home Financials are based on the most recent Mortgage that was taken out on this home.
Original Mortgage
$138,750
Interest Rate
6.25%
Mortgage Type
Purchase Money Mortgage
Create a Home Valuation Report for This Property
The Home Valuation Report is an in-depth analysis detailing your home's value as well as a comparison with similar homes in the area
Home Values in the Area
Average Home Value in this Area
Purchase History
| Date | Buyer | Sale Price | Title Company |
|---|---|---|---|
| Goncalves Nicholas A | -- | Executive Title Ogden | |
| Great American Homes Inc | -- | Heritage West Title Ins |
Source: Public Records
Mortgage History
| Date | Status | Borrower | Loan Amount |
|---|---|---|---|
| Open | Goncalves Nicholas A | $169,200 | |
| Previous Owner | Great American Homes Inc | $138,750 |
Source: Public Records
Tax History Compared to Growth
Tax History
| Year | Tax Paid | Tax Assessment Tax Assessment Total Assessment is a certain percentage of the fair market value that is determined by local assessors to be the total taxable value of land and additions on the property. | Land | Improvement |
|---|---|---|---|---|
| 2025 | $2,762 | $445,702 | $129,936 | $315,766 |
| 2024 | $2,668 | $240,899 | $71,464 | $169,435 |
| 2023 | $2,814 | $254,100 | $71,483 | $182,617 |
| 2022 | $2,625 | $243,100 | $68,753 | $174,347 |
| 2021 | $2,231 | $347,000 | $74,829 | $272,171 |
| 2020 | $2,129 | $305,000 | $59,977 | $245,023 |
| 2019 | $2,045 | $276,000 | $55,002 | $220,998 |
| 2018 | $1,932 | $248,000 | $49,832 | $198,168 |
| 2017 | $1,782 | $220,000 | $49,990 | $170,010 |
| 2016 | $1,594 | $105,100 | $24,791 | $80,309 |
| 2015 | $1,520 | $98,379 | $21,894 | $76,485 |
| 2014 | $1,421 | $88,986 | $21,894 | $67,092 |
Source: Public Records
Map
Nearby Homes
- 4317 S 3350 W
- 3434 W 4525 S
- 4491 Haven Creek Rd Unit A
- 4440 Stone Creek Rd Unit 2E
- 4510 Stone Creek Rd Unit F
- 3542 W 4200 S
- 4357 S 3700 W
- 4124 S 3560 W
- Villages Townhome Plan at Green Farm - Villages
- 3554 W 4100 S Unit 63
- 3652 W 4625 S
- 4351 W 4000 S
- 3632 W 4650 S
- 4666 S 3600 W
- 3692 W 4625 S
- 3669 W 4625 S
- 4045 S 3600 W
- 3627 W 4650 S
- 3385 W 3950 S
- 3959 S 3485 W
- 4355 S 3450 W
- 4363 S 3450 W
- 4377 S 3450 W
- 4345 S 3450 W
- 3429 W 4350 S
- 3434 W 4375 S
- 4292 Whisperwood Ct
- 4296 Whisperwood Ct
- 4288 Whisperwood Ct
- 4389 S 3450 W
- 4339 S 3450 W
- 4302 Whisperwood Ct
- 3416 W 4375 S
- 4286 Whisperwood Ct
- 3413 W 4350 S
- 4342 S 3450 W
- 4306 Whisperwood Ct
- 4282 Whisperwood Ct
- 4329 S 3450 W
- 3404 W 4375 S